
West Palm Beach
PREPARED BY
Teneka James
Office Submarket Report
Palm Beach - FL


Overview
West Palm Beach Office
6K 191K 9.3% 7.5%
12 Mo Deliveries in SF 12 Mo Net Absorption in SF Vacancy Rate 12 Mo Rent Growth
After a supply-driven increase in early 2021, the
submarket vacancy rate in West Palm Beach has
trended lower over the past few quarters. The
submarket's supply pipeline has emptied out, and supply-
side pressure should not have an impact on
fundamentals or rent growth in the near term.
The recent delivery of The Press, a 277,000-SF project,
brought new office space to the submarket for the first
time in more than a decade. The project was about 50%
available when it opened in 21Q1 and was still roughly
50% available for lease as of mid-2022. The asset is
anchored by Schwarzberg & Associates and the Palm
Beach Post, while the remainder of the office space is
being marketed for about $40/SF gross, some of the
highest rents in the submarket.
The submarket has the lowest average asking rents
among Palm Beach office submarkets. Submarket rent
growth hardly took a hit in the months following the onset
of the coronavirus pandemic, and owners have pushed
rents over the past few quarters. Year-over-year rent
growth of 7.5% is right around the Palm Beach metro
average and is above the submarket's five-year annual
average of 4.2%.
Office sales volume has increased in West Palm Beach
in recent quarters, but it remains below the submarket's
pre-pandemic norms. One of the largest recent deals
here was the June 2021 sale of Congress Center North
at Congress Crossings for $8.6 million ($205/SF).
Nashville-based Excelsior Capital acquired the 42,000-
SF office from Calidus Holdings at a 7% cap rate. In a
similar deal, the 63,000-SF Village Executive Offices
changed hands in October 2021 for $13.9 million
($221/SF) at a 6.8% cap rate. The late 1980s-built
property was fully leased at the time of sale. Individual
investors were on both the buyer and seller side of the
deal. The asset previously sold in 2017 for $8.3 million
($132/SF).
KEY INDICATORS
Market RentVacancy RateRBA
Current Quarter
Availability Rate
Net Absorption
SF
Deliveries SF
Under
Construction
$39.1518.2%1,667,670
4 & 5 Star
18.6% 37,587 0 0
$29.759.5%3,892,823
3 Star
12.5% 4,737 0 0
$26.904.0%2,908,677
1 & 2 Star
4.9% (19,089) 0 0
$30.629.3%8,469,170
Submarket
11.1% 23,235 0 0
Forecast
Average
Historical
Average
12 Month
Annual Trends
Peak When Trough When
7.7%11.3%-2.2%
Vacancy Change (YOY)
16.6% 2009 Q3 7.0% 2005 Q3
82,79963,331191K
Net Absorption SF
319,386 2006 Q1 (291,546) 2009 Q3
59,40890,4976K
Deliveries SF
355,830 2006 Q3 0 2018 Q2
3.2%2.4%7.5%
Rent Growth
10.5% 2016 Q3 -8.0% 2011 Q3
N/A$70.6M$207M
Sales Volume
$172.1M 2017 Q3 $8.7M 2009 Q3
6/17/2022
© 2022 CoStar Group - Licensed to Downtown Development Authority -
551652
Page 2

Leasing
West Palm Beach Office
NET ABSORPTION, NET DELIVERIES & VACANCY
VACANCY RATE
6/17/2022
© 2022 CoStar Group - Licensed to Downtown Development Authority -
551652
Page 3

Leasing
West Palm Beach Office
AVAILABILITY RATE
4 & 5 STAR MOST ACTIVE BUILDINGS IN SUBMARKET - PAST 12 MONTHS
Property Name/Address Rating RBA Deals Leased SF 12 Mo Vacancy 12 Mo Net Absorp SF
30,883
1641 Worthington Rd
EcoPlex At Centrepark West
100,525 4 26.5% 19,728
49,535
1700 Palm Beach Lakes Blvd
119,055 4 16.4% 18,514
20,094
1645 Palm Beach Lakes Blvd
The 1645 at Palm Beach Lakes
113,862 9 5.4% 8,241
7,849
2101 Vista Pky
The Nexus at Vista Park
60,000 7 0.9% 826
20,731
1601 Forum Pl
Centurion Tower
143,966 6 21.7% (4,916)
31,454
1555 Palm Beach Lakes Blvd
Tower 1555
180,000 8 17.4% (6,473)
4,879
1401 Forum Way
Horizon Office Center
67,185 1 34.2% (8,838)
46,378
2751 S Dixie Hwy
The Press
276,600 6 56.1% (14,868)
6/17/2022
© 2022 CoStar Group - Licensed to Downtown Development Authority -
551652
Page 4

Leasing
West Palm Beach Office
3 STAR MOST ACTIVE BUILDINGS IN SUBMARKET - PAST 12 MONTHS
Property Name/Address Rating RBA Deals Leased SF 12 Mo Vacancy 12 Mo Net Absorp SF
29,832
1655 Palm Beach Lakes Blvd
Forum C
92,556 10 10.7% 23,107
33,753
1665 Palm Beach Lakes Blvd
Forum B
92,473 7 11.8% 17,720
35,752
1720 Centrepark Dr E
Cemex Building
17,876 2 31.7% 14,166
25,998
1450 Centrepark Blvd
Centrepark 1450
74,413 4 21.1% 14,006
18,803
2090 Palm Beach Lakes Blvd
West Tower
74,199 5 20.9% 8,793
3,563
2465 Mercer Ave
Airport Professional Center
35,500 3 14.3% 7,594
6,000
1620 Southern Blvd
6,000 2 0% 6,000
26,828
1475 Centrepark Blvd
Centrepark 1475
74,695 2 2.4% 3,468
11,508
1818 S Australian Ave
57,940 4 9.0% 3,355
5,566
2500 Metrocentre Blvd
2500 Metrocentre Blvd
17,848 2 3.4% 3,055
3,553
6415 Lake Worth Rd
Lakeview Corporate Center
29,016 5 12.8% 2,913
5,800
560 Village Blvd
Village Executive Offices
62,875 2 3.1% 2,871
7,162
2001-2007 Palm Beach Lakes…
2001 Professional Building
49,648 6 7.2% 1,150
3,567
2328 10th Ave N
Lakeworth Corporate Center -…
46,703 3 3.0% 0
9,014
1926 10th Ave N
CenterPoint Plaza
88,544 2 5.0% (856)
10,378
2290 10th Ave N
Lakeworth Proffesional & Me…
50,500 8 5.2% (3,295)
14,183
120 N Federal Hwy
The Promenade at Lake Worth
63,423 6 18.2% (6,634)
2,257
2000 Palm Beach Lakes Blvd
East Tower
75,999 2 23.5% (7,429)
27,538
2056 Vista Parkway
Emerald View
70,000 5 27.8% (8,920)
14,236
580 Village Blvd
Palm Beach Business Center
60,615 10 13.7% (11,787)
6/17/2022
© 2022 CoStar Group - Licensed to Downtown Development Authority -
551652
Page 5

Rent
West Palm Beach Office
Office rents in West Palm Beach run for about $31.00/SF
gross, which is moderately below the metro average. The
same is true for 3 Star space, proportionally the
submarket's largest subtype, which at $30.00/SF rents
for less than the $37.00/SF metro average for that slice.
Rents grew by a remarkable 7.5% over the past year,
which brought the three-year average annual rent
growth up to 4.4%.
In a longer-term view, office rents in West Palm
Beach have increased at levels that border on
transformative. Office rents today are 54.7% above their
10-year-ago levels. Notably, this trails the even stronger
62.3% metro-wide uptick over the past decade.
MARKET RENT GROWTH (YOY)
6/17/2022
© 2022 CoStar Group - Licensed to Downtown Development Authority -
551652
Page 6

Rent
West Palm Beach Office
MARKET RENT PER SQUARE FEET
6/17/2022
© 2022 CoStar Group - Licensed to Downtown Development Authority -
551652
Page 7

Construction
West Palm Beach Office
DELIVERIES & DEMOLITIONS
6/17/2022
© 2022 CoStar Group - Licensed to Downtown Development Authority -
551652
Page 8
Construction
West Palm Beach Office
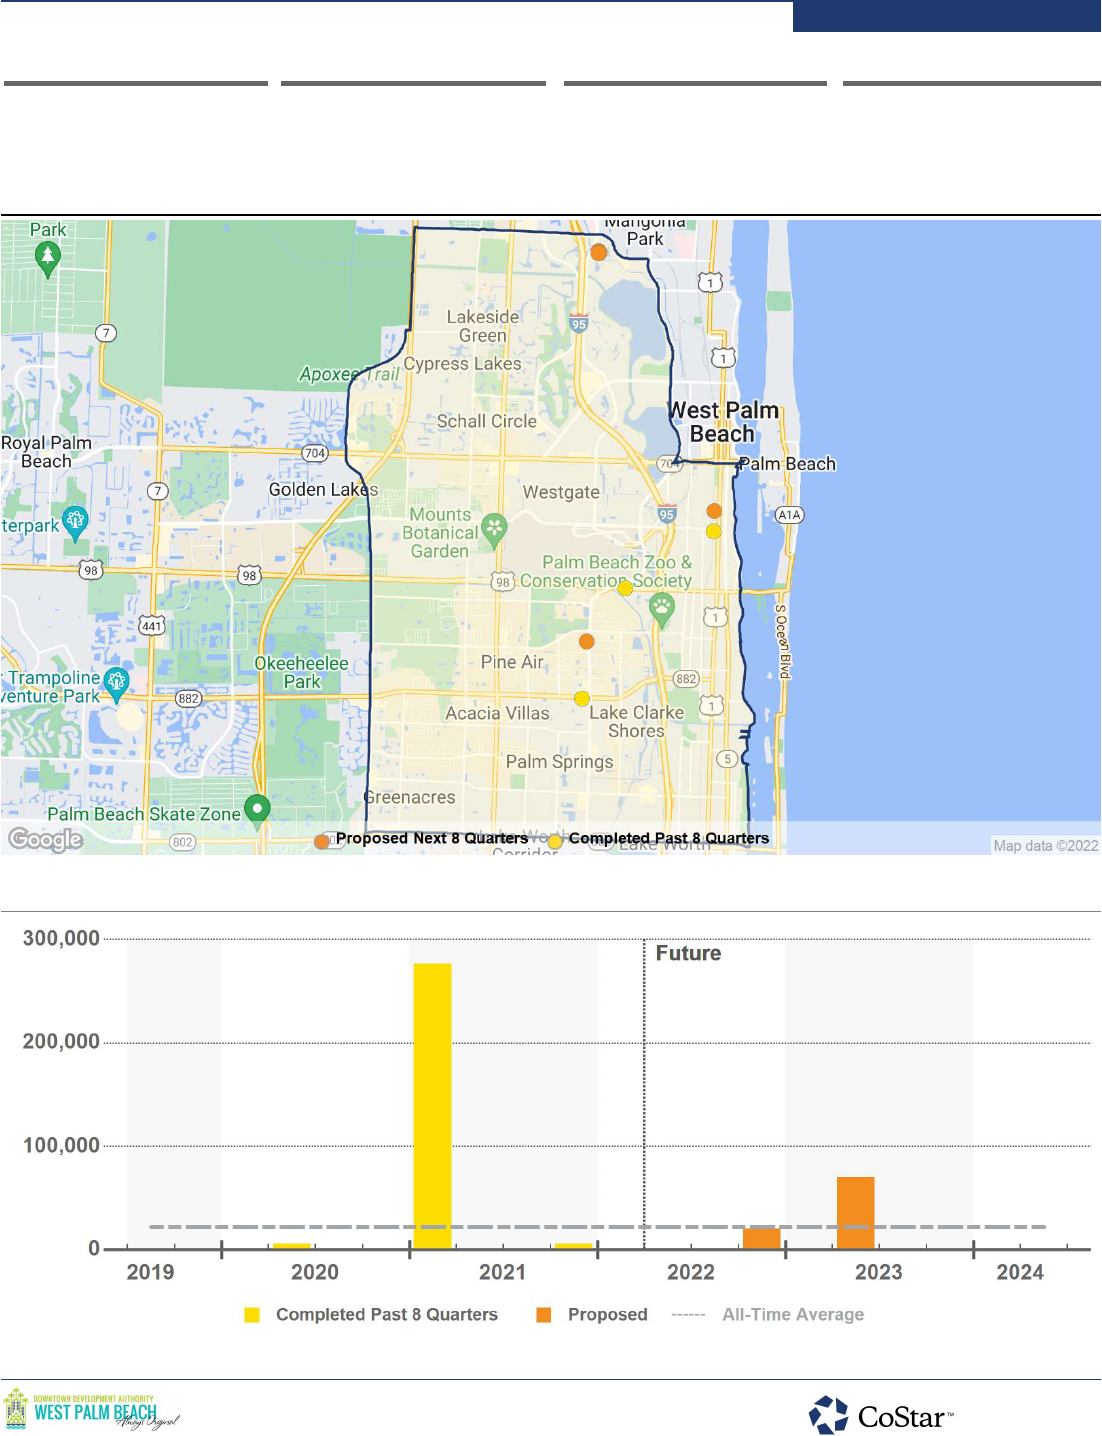
88,188 288,400 0 90,122
All-Time Annual Avg. Square Feet Delivered Square Feet Past 8 Qtrs Delivered Square Feet Next 8 Qtrs Proposed Square Feet Next 8 Qtrs
PAST 8 QUARTERS DELIVERIES, UNDER CONSTRUCTION, & PROPOSED
PAST & FUTURE DELIVERIES IN SQUARE FEET
6/17/2022
© 2022 CoStar Group - Licensed to Downtown Development Authority -
551652
Page 9

Construction
West Palm Beach Office
RECENT DELIVERIES
Property Name/Address Rating Bldg SF Stories Start Complete
Developer/Owner
Oct 2020
1620 Southern Blvd
6,000 1 Oct 2021
-
-
1
Aug 2019
2751 S Dixie Hwy
The Press
276,600 4 Jan 2021
Tricera Capital
Tricera Capital
2
Sep 2019
3098 Forest Hill Blvd
5,800 - Jun 2020
-
-
3
PROPOSED
Property Name/Address Rating Bldg SF Stories Start Complete
Developer/Owner
Aug 2022
412-420 Calremore Dr
Falmingo Place
25,522 2 Apr 2023
-
-
1
Sep 2022
839 S Congress Ave
20,000 2 Nov 2022
-
Matthew and Jennifer O'Conner
2
Apr 2022
4400 Beacon Cir
ECF Engeneering HQ Bl…
20,000 2 Apr 2023
E C Fennell PA
E C Fennell PA
3
Aug 2022
4400 Beacon Cir
ECF Engineering HQ Bld…
14,600 2 May 2023
E C Fennell PA
E C Fennell PA
4
Jul 2022
4400 Beacon Cir
ECF Engeneering HQ Bl…
10,000 2 Apr 2023
E C Fennell PA
E C Fennell PA
5
6/17/2022
© 2022 CoStar Group - Licensed to Downtown Development Authority -
551652
Page 10

Sales
West Palm Beach Office
Office investors have shown a significant appetite for
office assets in West Palm Beach, making it one of the
most heavily traded office submarkets in the region over
the past several years. Historical investment activity
trends have largely held true in the past 12 months. Over
the past five years, annualized sales volume has
averaged $108 million. But volume hit $205 million during
these past 12 months, the highest level recorded over
that five-year period.
The market price, based on the estimated price
movement of all office properties in the submarket, sat at
$249/SF during the second quarter of 2022. That figure
is up from this time last year, although the level is still a
significant discount relative to the average price for the
region. The market cap rate has contracted since last
year and currently sits at 6.7%. This is the lowest cap
rate that has been seen in five years, but it's still higher
than the region's average yield.
SALES VOLUME & MARKET SALE PRICE PER SF
6/17/2022
© 2022 CoStar Group - Licensed to Downtown Development Authority -
551652
Page 11
Sales
West Palm Beach Office
MARKET CAP RATE
6/17/2022
© 2022 CoStar Group - Licensed to Downtown Development Authority -
551652
Page 12

Sales Past 12 Months
West Palm Beach Office
61 6.3% $213 8.2%
Sale Comparables Avg. Cap Rate Avg. Price/SF Avg. Vacancy At Sale
SALE COMPARABLE LOCATIONS
SALE COMPARABLES SUMMARY STATISTICS
Sales Attributes Low Average Median
High
Sale Price $260,100 $5,642,488 $2,927,141 $32,500,000
Price/SF $34 $213 $194 $1,481
Cap Rate 3.7% 6.3% 7.0% 7.1%
Time Since Sale in Months 0.7 6.4 5.6 11.9
Property Attributes Low Average Median
High
Building SF 550 27,764 15,235 100,525
Stories 1 2 1 10
Typical Floor SF 550 12,080 11,043 39,899
Vacancy Rate At Sale 0% 8.2% 0% 71.7%
Year Built 1947 1981 1984 2008
Star Rating
2.5
6/17/2022
© 2022 CoStar Group - Licensed to Downtown Development Authority -
551652
Page 13

Sales Past 12 Months
West Palm Beach Office
Property Name - Address Rating
Yr Built
Bldg SF Vacancy Price Price/SF
Property
Sale Date
Sale
Cap Rate
RECENT SIGNIFICANT SALES
-
1
EcoPlex At Centrepark…
2008 100,525 15.8% $32,500,000 $323
1641 Worthington Rd
4/1/2022 -
-
2
Belcan Engineering
2000 65,770 0% $21,666,666 $329
2410 Metrocentre Blvd E
2/1/2022 -
-
3
Forum B
1973 92,473 3.2% $15,114,090 $163
1665 Palm Beach Lakes B…
1/28/2022 7.1%
-
4
Forum C
1973 92,556 4.0% $14,135,910 $153
1655 Palm Beach Lakes B…
1/28/2022 7.1%
-
5
Village Executive Offices
1989 62,875 6.0% $13,900,000 $221
560 Village Blvd
10/21/2021 6.8%
-
6
District Pointe
1983 72,600 0% $13,400,000 $185
1501 Belvedere Rd
11/19/2021 -
-
7
Horizon Office Center
1985 67,185 38.0% $13,025,000 $194
1401 Forum Way
2/2/2022 -
-
8
1551 Forum Pl
1980 39,899 15.8% $6,950,000 $1745/3/2022 -
-
9
Century Village
1970 28,346 27.5% $6,000,000 $212
100 Century Blvd
11/23/2021 3.7%
-
10
2400 Metrocentre Blvd E
1992 26,959 0% $5,975,000 $2227/14/2021 -
-
11
500 Columbia Dr
2000 24,857 0% $5,701,310 $22912/29/2021 -
-
12
Congress Professional C…
1997 15,200 0% $5,000,000 $329
1620 S Congress Ave
6/21/2021 -
-
13
1814 N Federal Hwy
1957 3,308 0% $4,900,000 $1,4814/11/2022 -
-
14
3071 Continental Dr
1992 26,500 0% $3,800,000 $1434/19/2022 -
-
15
1280 N Congress Ave
1984 22,085 0% $3,450,000 $15610/5/2021 7.1%
-
16
Four Harvard Circle
1988 15,235 26.3% $3,355,566 $220
4 Harvard Cir
5/24/2022 -
-
17
Peterson, Bernard Attor…
1986 20,000 54.4% $3,100,000 $155
1550 Southern Blvd
10/4/2021 -
-
18
2050 Vista Pky
1995 15,252 0% $3,050,400 $2007/22/2021 -
-
19
400 Columbia Dr
1990 17,009 16.1% $2,803,881 $16512/29/2021 -
-
20
1800 Building
1988 20,000 10.5% $2,800,000 $140
1800 Old Okeechobee Rd
9/24/2021 5.9%
6/17/2022
© 2022 CoStar Group - Licensed to Downtown Development Authority -
551652
Page 14

Supply & Demand Trends
West Palm Beach Office
OVERALL SUPPLY & DEMAND
Net AbsorptionInventory
% of Inv Construction RatioSF SF Growth % Growth SFYear
2026 70,081 0.8% 0.5%41,371 1.78,703,519
2025 76,916 0.9% 0.6%50,602 1.58,633,438
2024 73,367 0.9% 0.4%38,038 1.98,556,522
2023 21,400 0.3% 0.9%75,143 0.38,483,155
2022 (7,415) -0.1% 2.2%188,122 -8,461,755
YTD 0 0% 0.7%61,859 08,469,170
2021 282,600 3.5% 3.0%253,414 1.18,469,170
2020 5,800 0.1% 1.0%84,531 0.18,186,570
2019 (144,849) -1.7% -1.0%(80,442) -8,180,770
2018 (79,723) -0.9% -1.6%(130,272) -8,325,619
2017 (2,400) 0% 0.6%48,579 -8,405,342
2016 (52,525) -0.6% -3.4%(284,978) -8,407,742
2015 (48,816) -0.6% 2.3%190,734 -8,460,267
2014 907 0% 0.7%59,549 08,509,083
2013 (4,606) -0.1% 0.8%64,938 -8,508,176
2012 (24,070) -0.3% 2.0%170,003 -8,512,782
2011 (2,573) 0% 1.3%109,442 -8,536,852
2010 7,000 0.1% -0.2%(19,857) -8,539,425
4 & 5 STAR SUPPLY & DEMAND
Net AbsorptionInventory
% of Inv Construction RatioSF SF Growth % Growth SFYear
2026 85,992 4.6% 3.7%72,529 1.21,972,334
2025 92,678 5.2% 4.2%78,597 1.21,886,342
2024 89,011 5.2% 3.5%62,134 1.41,793,664
2023 36,983 2.2% 3.2%54,937 0.71,704,653
2022 0 0% 8.6%142,788 01,667,670
YTD 0 0% 1.4%23,174 01,667,670
2021 276,600 19.9% 7.5%125,302 2.21,667,670
2020 0 0% -3.0%(41,854) -1,391,070
2019 0 0% 1.6%21,646 01,391,070
2018 12,294 0.9% -1.1%(15,954) -1,391,070
2017 0 0% 5.9%81,588 01,378,776
2016 0 0% -0.3%(4,590) -1,378,776
2015 0 0% -2.4%(33,433) -1,378,776
2014 7,500 0.5% 0.7%9,667 0.81,378,776
2013 0 0% 0%(328) -1,371,276
2012 0 0% 3.1%43,013 01,371,276
2011 0 0% -0.2%(2,953) -1,371,276
2010 0 0% 2.0%27,616 01,371,276
6/17/2022
© 2022 CoStar Group - Licensed to Downtown Development Authority -
551652
Page 15

Supply & Demand Trends
West Palm Beach Office
3 STAR SUPPLY & DEMAND
Net AbsorptionInventory
% of Inv Construction RatioSF SF Growth % Growth SFYear
2026 0 0% -0.3%(11,887) -3,892,823
2025 0 0% -0.2%(9,572) -3,892,823
2024 0 0% -0.2%(6,745) -3,892,823
2023 0 0% 0.6%24,086 03,892,823
2022 0 0% 1.9%72,901 03,892,823
YTD 0 0% 1.4%53,719 03,892,823
2021 6,000 0.2% 1.0%39,714 0.23,892,823
2020 5,800 0.1% 3.4%131,844 03,886,823
2019 (4,320) -0.1% -4.2%(162,762) -3,881,023
2018 (92,017) -2.3% -2.3%(89,501) -3,885,343
2017 0 0% 0.6%24,110 03,977,360
2016 0 0% -2.9%(115,072) -3,977,360
2015 (47,568) -1.2% 3.8%151,184 -3,977,360
2014 0 0% 0.1%5,425 04,024,928
2013 (2,864) -0.1% 2.3%92,714 -4,024,928
2012 0 0% 2.3%93,679 04,027,792
2011 0 0% 1.8%73,555 04,027,792
2010 13,000 0.3% -0.5%(19,420) -4,027,792
1 & 2 STAR SUPPLY & DEMAND
Net AbsorptionInventory
% of Inv Construction RatioSF SF Growth % Growth SFYear
2026 (15,911) -0.6% -0.7%(19,271) -2,838,362
2025 (15,762) -0.5% -0.6%(18,423) -2,854,273
2024 (15,644) -0.5% -0.6%(17,351) -2,870,035
2023 (15,583) -0.5% -0.1%(3,880) -2,885,679
2022 (7,415) -0.3% -1.0%(27,567) -2,901,262
YTD 0 0% -0.5%(15,034) -2,908,677
2021 0 0% 3.0%88,398 02,908,677
2020 0 0% -0.2%(5,459) -2,908,677
2019 (140,529) -4.6% 2.1%60,674 -2,908,677
2018 0 0% -0.8%(24,817) -3,049,206
2017 (2,400) -0.1% -1.9%(57,119) -3,049,206
2016 (52,525) -1.7% -5.4%(165,316) -3,051,606
2015 (1,248) 0% 2.4%72,983 -3,104,131
2014 (6,593) -0.2% 1.4%44,457 -3,105,379
2013 (1,742) -0.1% -0.9%(27,448) -3,111,972
2012 (24,070) -0.8% 1.1%33,311 -3,113,714
2011 (2,573) -0.1% 1.2%38,840 -3,137,784
2010 (6,000) -0.2% -0.9%(28,053) -3,140,357
6/17/2022
© 2022 CoStar Group - Licensed to Downtown Development Authority -
551652
Page 16

Rent & Vacancy
West Palm Beach Office
OVERALL RENT & VACANCY
Market Rent
Per SF Index % Growth Vs Hist PeakYear
Vacancy
SF Percent Ppts Chg
2026 152 0.9% 15.5%$34.61 696,803 8.0% 0.3%
2025 151 1.4% 14.5%$34.31 667,384 7.7% 0.2%
2024 149 2.3% 13.0%$33.84 640,358 7.5% 0.4%
2023 145 4.3% 10.5%$33.10 604,281 7.1% -0.6%
2022 139 5.9% 5.9%$31.73 657,418 7.8% -2.3%
YTD 134 7.5% 2.2%$30.62 790,775 9.3% -0.7%
2021 131 7.6% 0%$29.96 852,634 10.1% 0.1%
2020 122 4.0% -7.0%$27.85 816,941 10.0% -1.0%
2019 118 1.3% -10.6%$26.78 895,672 10.9% -0.6%
2018 116 7.6% -11.7%$26.45 960,079 11.5% 0.7%
2017 108 -0.4% -18.0%$24.57 909,530 10.8% -0.6%
2016 108 10.3% -17.7%$24.66 960,509 11.4% 2.8%
2015 98 7.9% -25.4%$22.36 728,056 8.6% -2.8%
2014 91 6.0% -30.9%$20.71 970,631 11.4% -0.7%
2013 86 -0.4% -34.8%$19.53 1,029,273 12.1% -0.8%
2012 86 -0.1% -34.5%$19.61 1,098,817 12.9% -2.2%
2011 86 -5.8% -34.5%$19.63 1,292,890 15.1% -1.3%
2010 91 -2.7% -30.4%$20.84 1,404,905 16.5% 0.3%
4 & 5 STAR RENT & VACANCY
Market Rent
Per SF Index % Growth Vs Hist PeakYear
Vacancy
SF Percent Ppts Chg
2026 157 0.6% 14.3%$43.73 220,646 11.2% 0.2%
2025 156 1.1% 13.6%$43.47 207,224 11.0% 0.2%
2024 154 1.9% 12.4%$43.02 193,176 10.8% 1.0%
2023 151 4.1% 10.3%$42.21 166,333 9.8% -1.3%
2022 145 6.0% 6.0%$40.53 184,316 11.1% -8.6%
YTD 140 7.1% 2.3%$39.15 303,928 18.2% -1.4%
2021 137 6.2% 0%$38.26 327,102 19.6% 7.4%
2020 129 2.4% -5.8%$36.03 169,297 12.2% 3.0%
2019 126 2.2% -8.0%$35.18 127,443 9.2% -1.6%
2018 123 10.3% -10.0%$34.43 149,089 10.7% 2.0%
2017 112 6.1% -18.4%$31.21 120,841 8.8% -5.9%
2016 105 10.8% -23.1%$29.41 202,429 14.7% 0.3%
2015 95 5.9% -30.6%$26.53 197,839 14.3% 2.4%
2014 90 3.2% -34.5%$25.06 164,406 11.9% -0.2%
2013 87 -0.3% -36.5%$24.29 166,573 12.1% 0%
2012 87 2.9% -36.3%$24.37 166,245 12.1% -3.1%
2011 85 -8.7% -38.1%$23.69 209,258 15.3% 0.2%
2010 93 -4.2% -32.2%$25.95 206,305 15.0% -2.0%
6/17/2022
© 2022 CoStar Group - Licensed to Downtown Development Authority -
551652
Page 17

Rent & Vacancy
West Palm Beach Office
3 STAR RENT & VACANCY
Market Rent
Per SF Index % Growth Vs Hist PeakYear
Vacancy
SF Percent Ppts Chg
2026 150 0.9% 16.1%$33.62 355,820 9.1% 0.3%
2025 148 1.4% 15.1%$33.33 343,933 8.8% 0.2%
2024 146 2.3% 13.5%$32.87 334,361 8.6% 0.2%
2023 143 4.3% 11.0%$32.15 327,616 8.4% -0.6%
2022 137 6.5% 6.5%$30.83 351,702 9.0% -1.9%
YTD 132 8.6% 2.7%$29.75 370,880 9.5% -1.4%
2021 129 8.8% 0%$28.96 424,599 10.9% -0.9%
2020 118 4.6% -8.1%$26.62 458,313 11.8% -3.3%
2019 113 -0.9% -12.1%$25.45 584,357 15.1% 4.1%
2018 114 4.1% -11.4%$25.67 425,915 11.0% 0.2%
2017 110 -0.1% -14.9%$24.65 428,431 10.8% -0.6%
2016 110 9.8% -14.8%$24.67 452,541 11.4% 2.9%
2015 100 8.6% -22.4%$22.46 337,469 8.5% -4.9%
2014 92 4.6% -28.6%$20.68 539,246 13.4% -0.1%
2013 88 0.6% -31.8%$19.76 544,671 13.5% -2.4%
2012 87 0.2% -32.2%$19.63 640,249 15.9% -2.3%
2011 87 -3.0% -32.3%$19.60 733,928 18.2% -1.8%
2010 90 -3.5% -30.2%$20.21 807,483 20.0% 0.7%
1 & 2 STAR RENT & VACANCY
Market Rent
Per SF
Index % Growth Vs Hist Peak
Year
Vacancy
SF Percent Ppts Chg
2026 152 1.1% 15.7%$30.71 120,337 4.2% 0.2%
2025 150 1.6% 14.4%$30.36 116,227 4.1% 0.1%
2024 148 2.5% 12.6%$29.88 112,821 3.9% 0.1%
2023 144 4.5% 9.8%$29.15 110,332 3.8% -0.4%
2022 138 5.1% 5.1%$27.89 121,400 4.2% 0.7%
YTD 133 6.2% 1.3%$26.90 115,967 4.0% 0.5%
2021 131 7.0% 0%$26.55 100,933 3.5% -3.0%
2020 123 4.5% -6.5%$24.82 189,331 6.5% 0.2%
2019 117 3.6% -10.5%$23.75 183,872 6.3% -6.3%
2018 113 10.9% -13.7%$22.91 385,075 12.6% 0.8%
2017 102 -5.8% -22.2%$20.65 360,258 11.8% 1.8%
2016 108 10.6% -17.4%$21.92 305,539 10.0% 3.8%
2015 98 8.5% -25.4%$19.82 192,748 6.2% -2.4%
2014 90 10.7% -31.2%$18.26 266,979 8.6% -1.6%
2013 81 -2.2% -37.9%$16.49 318,029 10.2% 0.8%
2012 83 -2.8% -36.5%$16.85 292,323 9.4% -1.8%
2011 86 -7.6% -34.7%$17.35 349,704 11.1% -1.3%
2010 93 -0.1% -29.3%$18.77 391,117 12.5% 0.7%
6/17/2022
© 2022 CoStar Group - Licensed to Downtown Development Authority -
551652
Page 18

Sale Trends
West Palm Beach Office
OVERALL SALES
Completed Transactions (1)
Turnover Avg Price/SFDeals
Volume
Year
Market Pricing Trends (2)
Avg Price
Price Index
Avg Cap Rate Price/SF Cap Rate
2026 -- - -- 211- $278.16 6.9%
2025 -- - -- 210- $277 6.8%
2024 -- - -- 209- $274.97 6.8%
2023 -- - -- 206- $270.74 6.7%
2022 -- - -- 196- $258.60 6.7%
YTD $123.5M25 7.8% $223.33$6,177,213 1896.3% $249.30 6.7%
2021 $110.7M49 8.3% $199.47$3,163,732 1846.5% $242.49 6.7%
2020 $76.7M57 7.4% $153.68$1,916,295 1706.6% $224.05 7.0%
2019 $127.8M40 7.8% $208.58$3,992,289 1637.2% $215.09 7.1%
2018 $82.9M51 6.8% $159.82$2,762,488 1586.8% $208.58 7.0%
2017 $80.8M48 9.2% $112.55$2,308,014 1456.2% $190.57 7.1%
2016 $171M73 15.6% $135.01$3,489,167 1407.4% $183.84 7.1%
2015 $59.1M56 7.9% $95.92$1,285,849 1277.8% $167.79 7.3%
2014 $32.5M52 6.2% $75.27$903,805 11810.7% $155.99 7.4%
2013 $20.1M40 3.7% $69.44$592,255 10810.3% $142.83 7.7%
2012 $52.6M27 5.6% $117.53$2,767,036 1078.0% $140.92 7.8%
2011 $37.1M24 5.7% $78.77$2,318,674 1067.8% $139.16 7.9%
(1) Completed transaction data is based on actual arms-length sales transactions and levels are dependent on the mix of what happened to sell in the period.
(2) Market price trends data is based on the estimated price movement of all properties in the market, informed by actual transactions that have occurred.
4 & 5 STAR SALES
Completed Transactions (1)
Turnover Avg Price/SFDeals
Volume
Year
Market Pricing Trends (2)
Avg Price
Price Index
Avg Cap Rate Price/SF Cap Rate
2026 -- - -- 210- $326.62 6.5%
2025 -- - -- 210- $326.12 6.5%
2024 -- - -- 209- $324.69 6.5%
2023 -- - -- 207- $320.77 6.4%
2022 -- - -- 198- $306.92 6.3%
YTD $67.2M3 14.0% $287.78$22,397,222 191- $296.18 6.3%
2021 -- - -- 189- $294.23 6.3%
2020 -- - -- 172- $267.56 6.6%
2019 $51.9M2 18.9% $197.13$25,925,000 1667.3% $257.63 6.7%
2018 $22.3M1 4.7% $339.06$22,300,000 1655.7% $256.80 6.4%
2017 $11.8M1 4.8% $179.81$11,825,953 152- $236.32 6.5%
2016 $60.3M4 25.2% $173.64$15,073,514 1448.0% $223.85 6.5%
2015 $10.2M1 4.9% $151.82$10,200,000 1347.2% $207.93 6.6%
2014 $500K1 0.4% $83.33$500,000 125- $194.53 6.7%
2013 $3.5M1 4.4% $57.95$3,477,091 115- $179.02 7.0%
2012 $33.9M2 17.0% $145.48$16,942,750 1118.5% $173.01 7.1%
2011 $14.3M2 13.2% $78.71$7,125,000 111- $171.90 7.2%
(1) Completed transaction data is based on actual arms-length sales transactions and levels are dependent on the mix of what happened to sell in the period.
(2) Market price trends data is based on the estimated price movement of all properties in the market, informed by actual transactions that have occurred.
6/17/2022
© 2022 CoStar Group - Licensed to Downtown Development Authority -
551652
Page 19

Sale Trends
West Palm Beach Office
3 STAR SALES
Completed Transactions (1)
Turnover Avg Price/SFDeals
Volume
Year
Market Pricing Trends (2)
Avg Price
Price Index
Avg Cap Rate Price/SF Cap Rate
2026 -- - -- 207- $266.11 6.9%
2025 -- - -- 206- $265.02 6.9%
2024 -- - -- 205- $263.08 6.9%
2023 -- - -- 202- $258.98 6.8%
2022 -- - -- 193- $247.49 6.8%
YTD $37.3M8 8.6% $161.68$6,216,761 1867.1% $238.55 6.7%
2021 $68.1M14 10.9% $198.65$6,805,167 1796.2% $230.07 6.8%
2020 $48.8M22 9.6% $163.50$2,869,659 1686.3% $216.18 7.0%
2019 $62M17 7.0% $230.01$3,873,094 1637.2% $209.10 7.1%
2018 $46.1M19 10.0% $121.60$4,188,159 1588.0% $202.78 7.1%
2017 $45.2M19 13.1% $93.46$2,823,311 1437.0% $183.89 7.2%
2016 $95.9M23 20.2% $121.97$5,329,826 1377.2% $176.11 7.2%
2015 $30.6M17 10.2% $82.97$2,184,352 1258.0% $160.77 7.4%
2014 $21.5M21 9.4% $74.14$1,537,652 1178.9% $149.89 7.5%
2013 $6.1M11 3.4% $48.16$609,397 10715.0% $137.52 7.8%
2012 $13.1M5 3.9% $83.12$2,618,000 1085.7% $138.51 7.8%
2011 $13.7M5 4.7% $74.43$4,557,260 106- $136.03 7.9%
(1) Completed transaction data is based on actual arms-length sales transactions and levels are dependent on the mix of what happened to sell in the period.
(2) Market price trends data is based on the estimated price movement of all properties in the market, informed by actual transactions that have occurred.
1 & 2 STAR SALES
Completed Transactions (1)
Turnover Avg Price/SFDeals
Volume
Year
Market Pricing Trends (2)
Avg Price
Price Index
Avg Cap Rate Price/SF Cap Rate
2026 -- - -- 217- $266.52 7.0%
2025 -- - -- 216- $264.87 7.0%
2024 -- - -- 214- $262.39 6.9%
2023 -- - -- 210- $257.79 6.8%
2022 -- - -- 200- $245.76 6.8%
YTD $19.1M14 3.2% $214.02$1,732,003 1934.8% $236.81 6.8%
2021 $42.7M35 9.8% $200.80$1,707,158 1876.8% $229.45 6.8%
2020 $27.9M35 8.0% $139.05$1,211,635 1717.1% $209.65 7.1%
2019 $13.9M21 3.6% $174.10$995,269 1627.1% $198.72 7.2%
2018 $14.5M31 3.5% $196.17$805,828 1545.4% $188.71 7.2%
2017 $23.8M28 6.0% $141.01$1,321,197 1416.1% $173.29 7.3%
2016 $14.7M46 5.2% $111.21$545,862 140- $171.26 7.2%
2015 $18.4M38 6.2% $101.55$592,520 1267.9% $154.19 7.5%
2014 $10.5M30 4.7% $77.34$500,470 11611.6% $142.06 7.6%
2013 $10.6M28 3.8% $102.13$459,375 1057.9% $129.20 8.0%
2012 $5.6M20 2.8% $98.35$466,516 10312.0% $125.74 8.2%
2011 $9.2M17 3.8% $86.36$834,273 1027.8% $124.56 8.2%
(1) Completed transaction data is based on actual arms-length sales transactions and levels are dependent on the mix of what happened to sell in the period.
(2) Market price trends data is based on the estimated price movement of all properties in the market, informed by actual transactions that have occurred.
6/17/2022
© 2022 CoStar Group - Licensed to Downtown Development Authority -
551652
Page 20
