
Sun and Stars
Supplemental science materials
for grades 5 - 8

Curriculum Specialist
Solar Astronomers
Page Layout and Design
These supplemental curriculum materials are sponsored by the
Stanford SOLAR (Solar On-Line Activity Resources) Center. In
conjunction with NASA and the Learning Technologies Channel.
Susanne AshbySusanne Ashby
Susanne AshbySusanne Ashby
Susanne Ashby
Paul MortfieldPaul Mortfield
Paul MortfieldPaul Mortfield
Paul Mortfield
Todd HoeksemaTodd Hoeksema
Todd HoeksemaTodd Hoeksema
Todd Hoeksema
Amberlee ChausseeAmberlee Chaussee
Amberlee ChausseeAmberlee Chaussee
Amberlee Chaussee

3
Table of Contents
Teacher Overview
Objectives
Science Concepts
Correlation to the National Science Standards
Segment Content/On-line Component Review
Materials List
Explorations
Science Explorations
• Sizing Up the Stars
• From a Distance
• Wavelength and Energy
• Resonance Rings
• Spectroscopic Observations
Career Explorations (see the Web site for more about these careers)
• Laser Light Show technician
• Solar Scientist
• Astrophysicist
• Forensic Scientist
Answer Keys
• Student Worksheet:
Our Sun is a Special Star
• Student Worksheet:
The Electromagnetic Spectrum
• Science Exploration Guidesheet:
Spectroscopic Observation #3
Student Handouts
• Student Reading:
Our Sun is a Special Star
• Student Worksheet:
Our Sun is a Special Star
• Student Reading:
The Electromagnetic Spectrum
• Student Worksheet:
The Electromagnetic Spectrum
• Student Reading:
Spectroscopy: Star Light, Star Bright
• Science Exploration Guidesheet:
Sizing Up the Stars
• Science Exploration Guidesheet:
From a Distance
• Science Exploration Guidesheet:
Spectroscopic Observation #1:
Observing Spectra
• Science Exploration Guidesheet:
Spectroscopic Observation #2:
Mystery Gas Tube
• Science Exploration Guidesheet:
Spectroscopic Observation #3:
Solar Spectrum
• Career Exploration Guidesheet:
Compare Two Careers
Appendix
• Solar Glossary
• Web Work

• Objectives
• Science Concepts
• Correlation to the National Science Standards
• Segment Content/On-line Component Review
• Materials List

5
Teacher Overview
Objectives
1. Students will observe that the visible spectrum is only a part of what our sun, a star, emits
within the electromagnetic spectrum.
2. Students will study how astronomers use special tools (spectroscope) to learn more about
objects that are so far away.
3. Students will observe how white light can be refracted to form a color spectrum that has a
pattern.
4. Students will learn what spectroscopic data can specifically tell astronomers about the sun and
other stars.
5. Students will observe a Doppler Shift and what it indicates about a celestial object.
6. Students will determine that the distance of an object from an observer affects the appar-
ent size of said object.
7. Students will see how other careers are connected to spectroscopy.
8. Students will understand how technological design can help scientists to better understand our
Earth, our Sun, our solar system and the universe around us.

6
Teacher Overview
Science Concepts
1. Our sun is really a star in that it has the same characteristics as the other stars visible in the
sky, but because it is the closest star to Earth and the Earth revolves around it, it is also called
the Sun.
2. The sun contains different kinds of hot gases that interact in a special way to give off heat,
light and other kinds of energy which can be classified as the electromagnetic spectrum.
3. Scientists use technological design to develop tools such as a spectroscope to learn more
about celestial objects. Spectroscopic analysis tells what elements the celestial object is burn-
ing, if it is moving away or towards Earth, tells us its temperature which way an object is
rotating and how fast. (Doppler Shift, Emission Lines)
4. The Sun gives off light we can see. It is white light that we can bend or refract. When refract-
ing white light we get colors like in a “rainbow” (ROY G BIV) which is known as the color
spectrum.
5. The electromagnetic spectrum is composed of various forms of light arranged according to
their increasing frequency and decreasing wavelength. See diagram below.
The Electromagnetic SpectrumThe Electromagnetic Spectrum
The Electromagnetic SpectrumThe Electromagnetic Spectrum
The Electromagnetic Spectrum

7
Teacher Overview
Correlation to the National Science Standards
Grades 5 - 8
This segment of the Webcast
All About the Sun,
“Sun and Stars”, is brought to you by a
correlation to the National Science Standards for grades 5 - 8 as delineated below.
Unifying Concepts and Processes
• Evidence, models, and explanation
• Changes, constancy, and measurement
• Form and function
Science as Inquiry
• Abilities necessary to do scientific inquiry
• Identify questions that can be answered through scientific investigation
• Design and conduct a scientific investigation
• Use appropriate tools and techniques to gather, analyze and interpret data.
• Develop descriptions, explanations, and predictions, and models using evidence
• Think critically and logically to make the relationships between evidence and
explanations
• Understandings about scientific inquiry
Physical Science
• Transfer of energy
Earth and Space Science
• Structure of the Earth system
• Earth in the solar system
Science and Technology
• Abilities of technological design
• Identify appropriate problems for technological design
• Design a solution or product
• Implement a proposed design
• Evaluate completed technological products or designs
• Communicate the process of technological design
• Understandings about science and technology
Science in Personal and Social Perspectives
• Science and technology in society
History and Nature of Science
• Science as a human endeavor
• Nature of science

8
Teacher Overview
Segment Content/On-line Component Review

9
Teacher Overview
Materials List
Science Exploration
••
••
•
Sizing Up the StarsSizing Up the Stars
Sizing Up the StarsSizing Up the Stars
Sizing Up the Stars
Per small group, partner, or small team
• Long, flat surface (table, counter top, sidewalk)
• Two identically sized round objects (tennis ball, rubber racquetball, golf ball, ping
pong ball, balled up sheets of paper, marble, bubblegum ball, etc. (These round
objects are listed according to size.)
• 1 round object of a slightly smaller size than the other two round objects (For example,
if a group has two tennis balls, then the smaller round object should be a rubber
racquetball or golf ball.)
• Measuring tape or meter stick (The students will need to be able to mark and measure
distances.)
• ruler
• Student Guidesheet: Sizing Up the Stars
••
••
•
From a DistanceFrom a Distance
From a DistanceFrom a Distance
From a Distance
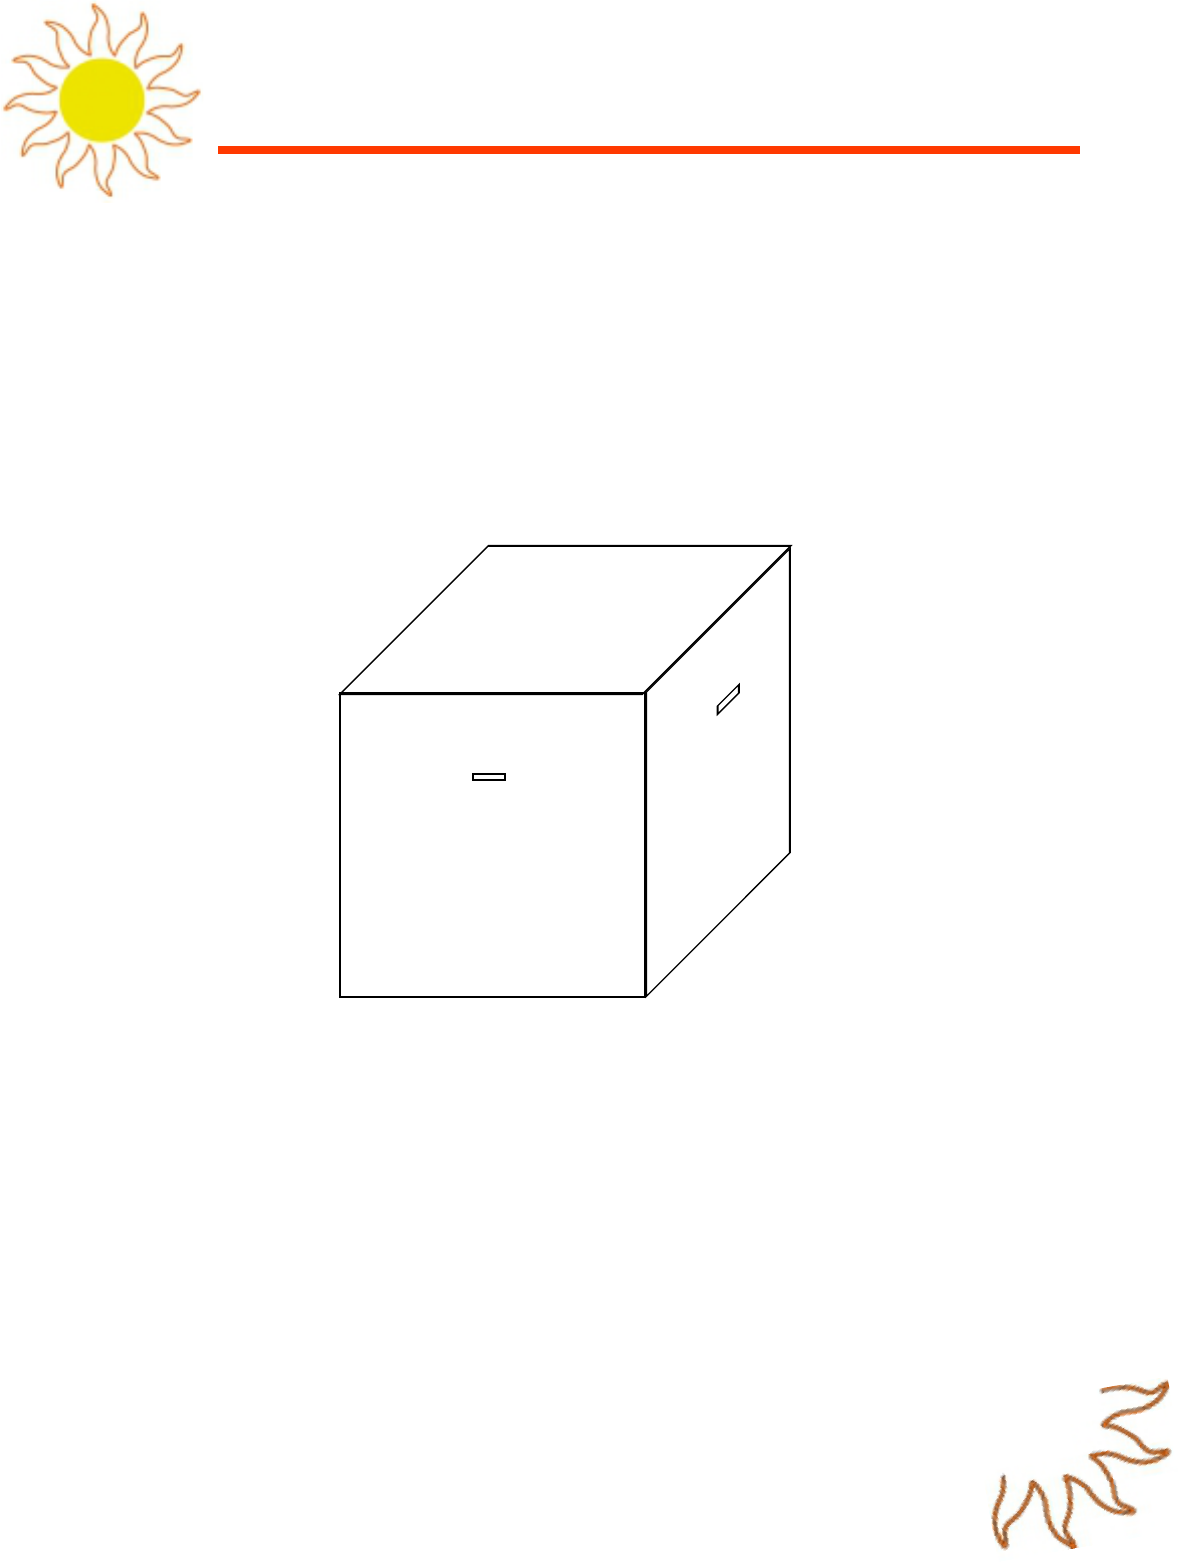
• Using the materials listed below construct the following
• “Mystery Light Source” (see diagram “A”):
• yellow balloon
• petroleum jelly (enough to fill the balloon to a diameter of at least 2 inches)
• flashlight
• small box (the same height as the flashlight when standing with light end facing up)
• Diagram “A”:
small boxsmall box
small boxsmall box
small box
flashlightflashlight
flashlightflashlight
flashlight
hole at top of boxhole at top of box
hole at top of boxhole at top of box
hole at top of box
Petroleum jelly filled balloonPetroleum jelly filled balloon
Petroleum jelly filled balloonPetroleum jelly filled balloon
Petroleum jelly filled balloon
10
Teacher Overview
Materials List (continued)
••
••
•
From a Distance (continued)From a Distance (continued)
From a Distance (continued)From a Distance (continued)
From a Distance (continued)
• *Mystery Light Source” Box (see diagram “B”):
• 3’ by 3’ box (It needs to be large enough and dark enough to sufficiently hide what the
light source inside is.)
• 1” wide and 3” to 4” long viewing station (one per side)
• Diagram “B”:
••
••
•
Wavelength and EnergyWavelength and Energy
Wavelength and EnergyWavelength and Energy
Wavelength and Energy
• Rope approximately 30 – 50 feet in length
• Long, smooth-surface floor
••
••
•
Resonance RingsResonance Rings
Resonance RingsResonance Rings
Resonance Rings
• Used lightweight file folders or similar weight construction paper from which to cut
strips 3 cm x 30 cm and 3 cm x 35 cm (one of each per student pair or work group)
• Cardboard sheets about 20 cm x 30 cm (one per student pair or work group)
• Masking tape
• Scissors
• cm measuring tool
3 ft.3 ft.
3 ft.3 ft.
3 ft.
3 ft.3 ft.
3 ft.3 ft.
3 ft.
3 ft.3 ft.
3 ft.3 ft.
3 ft.
1”1”
1”1”
1”
3” - 4”3” - 4”
3” - 4”3” - 4”
3” - 4”
1”1”
1”1”
1”
3” - 4”3” - 4”
3” - 4”3” - 4”
3” - 4”

11
Teacher Overview
Materials List (continued)
••
••
•
Spectroscopic ObservationsSpectroscopic Observations
Spectroscopic ObservationsSpectroscopic Observations
Spectroscopic Observations
• Spectroscope
• Spectroscope poster (with scope template and directions)
• To order this invaluable poster check the Web site:
http://solar-center.stanford.edu/poster
• 11” x 17” spectroscope template sheet
• 11” x 17” black card stock
• Diffraction Grating
• Edmund Scientific 609-573-6250
• Catalog # F39502 $23.60 for a package of 25
• Catalog #F50183 $58.00 for package of 80
• Scissors
• Straight edge (used to bend the cardboard)
• Clear tape
• Glue stick
• Gas tubes or Web site’s spectra for spectral analysis
• Student Guidesheet:
Spectroscopic Observations #1, #2 & #3

• Science Explorations
• Sizing Up the Stars
• From a Distance
• Wavelength and Energy
• Resonance Rings
• Spectroscopic Observations
• #1: Observing Spectra
• #2: Mystery Gas Tube
• #3: Solar Spectrum
• Career Explorations
(see the Web site for more about these careers)
• Solar Scientist
• Astrophysicist
• Aquaculturist

13
Science Exploration Guidesheet
Science Explorations
••
••
•
Sizing Up the StarsSizing Up the Stars
Sizing Up the StarsSizing Up the Stars
Sizing Up the Stars
Purpose: This activity is designed to get students to observe that two objects of equal size
can appear to be of different sizes when placed at a greater or lesser distance from the
observer. This is intended to assist students in visualizing that the sun is actually quite a
small star compared to other stars, but because our planet is so much closer to the sun
than to any other star, the sun appears much larger.
Distribute the student guidesheet Sizing Up the Distance and review the directions for the
activity. Instruct the students to place and hold the round object on the table while measur-
ing from the front edge of the round object emphasizing the importance of consistency in
measurement for accuracy. Remind the students that when they are observing they should
place their “eyes” in the same place each time, perhaps placing their chin directly on the
flat surface.
The questions on the guidesheet will lead the students to develop a procedure similar to
what is given below:
• Place the two equal size round objects 30 cm apart and 90 cm from the observer’s
eyes (the edge of the flat surface).
• Observe and compare the apparent size of the round objects.
• Leave the round object on the right in its position. Maintaining the 30 cm separation
between the two equal size round objects, place the left one at a closer distance to the
observer from the one on the right.
• Observe and compare the apparent size of the round objects.
• Leave the round object on the right in its position. Maintaining the 30 cm separation
between the two equal size round objects, place the left one at a greater distance to
the observer than the right round object is.
• Observe and compare the apparent size of the round objects.
• Repeat the procedure except leave the left round object in place while moving the right
round object closer and farther away from the observer.

14
Science Exploration Guidesheet
Science Explorations (continued)
••
••
•
Sizing Up the Stars (continued)Sizing Up the Stars (continued)
Sizing Up the Stars (continued)Sizing Up the Stars (continued)
Sizing Up the Stars (continued)
• Using one small round object and one larger round object, the students will be asked
to place the round objects in such a way as to make them appear the same size. Note:
Based upon their previous observations, the students should be able to ascertain that to
make the smaller round object appear equal in size to the larger object, it must be
placed closer to the observer than the larger round object.
• Using one small round object and one larger round object, the students will be asked
to place the round objects in such a way as to make the smaller round object appear
larger than the larger sized round object. Note: Based upon their previous observa-
tions, the students should be able to ascertain that to make the small round object
appear larger it must be placed even closer to the observer than where it was placed
previously OR the larger round object will need to be moved farther back than where it
had been previously placed.

15
Science Exploration Guidesheet
Science Explorations (continued)
••
••
•
From a Distance From a Distance
From a Distance From a Distance
From a Distance
Purpose: Students will utilize their abilities for technological design to perform science
inquiry by proposing methods for obtaining information about a faraway object without
being able to handle it or get close to it. The students will see how sometimes the inquiry
that drives science is what drives the development of technology.
• To develop the “Mystery Light Box” for this activity, follow the instructions found under
this activity’s name in the Materials section.
• Have students work in small groups of two to four, following the instructions on their
student guidesheet, and answering the questions.
• Review with the students the directions for the activity as stated on the Science
Exploration Guidesheet: Mystery Box Light
• The students are to observe what is in the box and draw what they see.
• Have students brainstorm in small groups what kind of questions they would like
answered about the light source in the Mystery Light Box. Post the lists and decide upon
3 -5 questions that they will answer.
• Back in their small groups, they discuss ways (2 to 4) they can answer these questions
about this mystery light without doing the following:
• removing the object from the box
• removing the box from above the object
• shining a light into the box
• reaching in with their hands to touch it
• After a brief explanation of how the search for answers leads scientists to invent better
ways to find answers (through technological design), have your students return to their
small groups and brainstorm 2 to 4 design suggestions that will help to answer each
question. Assure them not to worry about whether it is possible to create the techno-
logical tools in class or not, but to simply come up with the new ideas for technological
design.
• Have the small groups post their ideas for ways to obtain answers to the questions.

16
Science Exploration Guidesheet
Science Explorations (continued)
••
••
•
From a Distance (continued)From a Distance (continued)
From a Distance (continued)From a Distance (continued)
From a Distance (continued)
• In a whole class forum, the students share their suggestions and the class then votes on
the most feasible methods that the students themselves could actually perform.
• Ask students to determine what materials will be needed and have these materials
available for the next session when these new designs will be used to find the answers
to the questions.
• For the next class session have the necessary materials and assign each small group
one or two questions to answer.
• Then use the remainder of the class session for the small groups to development, test,
refine and use the design to gather the information.
• Depending upon the amount of time it will take for the students to perform their tests
(as there will probably be only one Mystery Light Box), this might require another class
session. Students could also be given alternative tasks to do while awaiting their oppor-
tunity to gather the information from the Mystery Light Box.
• Example Note: Below is a breakdown of the types of questions the students might wish
to have answered followed by the type of technological design ideas they might sug-
gest. This is provided to give an idea of just how this activity could evolve.
• Types of Questions about the mystery light source:
• What is it made of inside?
• What is its temperature?
• How does it make its light?
• What is its energy source?
• How large (or small) is it?

17
Science Exploration Guidesheet
Science Explorations
••
••
•
From a Distance (continued)From a Distance (continued)
From a Distance (continued)From a Distance (continued)
From a Distance (continued)
• Technological designs to assist in gathering the information needed to answer the
questions:
• Create a probe that acts like a syringe and can be remotely stuck into the mystery
light source using a long stick. The material inside could then be brought out for
further examination.
• Place a thermometer on a long stick and remotely “take the temperature” of the
light source.
• Use the spectroscope to analyze what type of light it is generating.
• Take close-up (flash) photo pictures to reveal more about the light source
• Look at it with binoculars
• Develop a way to measure its size from a distance (such as measuring how far
away it is from the viewing point and the angle created from its width).
••
••
•
Wavelength and EnergyWavelength and Energy
Wavelength and EnergyWavelength and Energy
Wavelength and Energy
• This activity provides a graphic demonstration of the relationship between energy and
wavelength and should be included as part of a discussion about the electromagnetic
spectrum. High-frequency waves (short wavelength) represent more energy than low-
frequency (long wavelength) waves. This activity is easiest to observe when done on a
smooth floor surface.
• Select 2 students to hold opposite ends of a 30 - 50 foot rope.
• While 1 end of the rope is held still, have the other student shake the opposite end up
and down at a moderate, but steady rate.

18
Science Exploration Guidesheet
Science Explorations (continued)
••
••
•
Wavelength and Energy (continued)Wavelength and Energy (continued)
Wavelength and Energy (continued)Wavelength and Energy (continued)
Wavelength and Energy (continued)
• Ask the remaining students to observe the wave patterns created in the rope. Point out
wave crests. Ask students to estimate the wavelength and frequency of waves reaching
the other student. The wavelength is the distance from wave crest to wave crest. Fre-
quency is the number of waves reaching the far end of the rope each second.
• Have the student shaking the rope shake it a little faster. Again have the students
estimate the wavelength and frequency.
• Have the student shaking the rope shake the rope as quickly as he or she can. Again,
have the class estimate the wavelength and frequency.
• Stop the demonstration and ask the student shaking the rope if it is easier to produce
low frequency waves (short wavelength) or high frequency (short wavelength) waves.
• Discuss the implications this demonstration has for the electromagnetic spectrum.
••
••
•
Resonance RingsResonance Rings
Resonance RingsResonance Rings
Resonance Rings
• All objects have a natural frequency at which they vibrate. When the frequency of the
shaking matches the frequency of one of the rings in this activity, it begins to vibrate
more than the rest. In other words, some of the energy in the shaking is absorbed by
that ring. This effect is called resonance.
• Resonance takes place when energy of the right frequency (or multiples of the right
frequency) is added to an object causing it to vibrate.

19
Science Exploration Guidesheet
Science Explorations (continued)
••
••
•
Resonance RingsResonance Rings
Resonance RingsResonance Rings
Resonance Rings
(continued)(continued)
(continued)(continued)
(continued)
• When electromagnetic radiation enters the Earth’s atmosphere, certain wavelengths
match the natural frequencies of atoms and molecules of various atmospheric gases
such as nitrogen and ozone. When this happens, the energy in those wavelengths is
absorbed by those atoms or molecules, intercepting this energy before it can reach the
Earth’s surface.

20
Science Exploration Guidesheet
Science Explorations (continued)
••
••
•
Resonance RingsResonance Rings
Resonance RingsResonance Rings
Resonance Rings
(continued)(continued)
(continued)(continued)
(continued)
• Wavelengths that do not match the frequencies of the atoms and molecules found in
the gases present will pass on through to the Earth’s surface.
• Resonance is important to astronomy for another reason. All starlight begins in the
center of the star as a product of nuclear fusion. As the radiation emerges from the
photosphere or surface of the star, some wavelengths of radiation may be missing. The
missing components produce dark lines in the star’s spectra, called absorption lines.
These lines are created as the radiation passes through the outer gaseous layers of the
star. Some of that radiation will be absorbed as various gas atoms which are present
begin to resonate. Absorption lines (dark lines in a star’s spectra) tell scientists what
elements are present in the outer gaseous layers of the star.
• Procedures for this exploration:
• Cut 2 strips of paper from used file folders. One strip should be 3 cm wide and
approximately 30 cm in length, with the other being 3 cm wide and 35 cm in
length.
• Curl each strip into a cylinder and tape the ends together.
• Tape the cylinders to the cardboard as shown in the diagram below. (Note: If the
ring has a crease in it, the crease should be at the bottom.)
• Holding the cardboard, slowly shake it back and forth.
• Gradually increase the frequency of the shaking.
• Observe what happens when the frequency of the shaking is gradually increased.

21
Science Exploration Guidesheet
Science Explorations (continued)
••
••
•
Spectroscopic ObservationsSpectroscopic Observations
Spectroscopic ObservationsSpectroscopic Observations
Spectroscopic Observations
For these activities students will construct their own spectroscope, observe common light
sources, record their spectra and compare their findings with fellow classroom scientists.
For directions to build a spectroscope, see the Spectroscope Poster (purchase information
found in the Materials List. Allow approximately 3 class sessions to construct and calibrate
the spectroscopes before having students perform these science explorations.
Unlike a prism, which disperses white light into the rainbow colors through refraction, the
diffraction grating used in this homemade spectroscope disperses white light through a
process called
interference
The grating used for this spectroscope consists of a transpar-
ent piece of plastic with many thousands of microscopic parallel grooves. Light passing
between these grooves is dispersed into its component wavelengths and appears as paral-
lel bands of color on the retina of the observer’s eyes.
••
••
•
Spectroscopic Observation #1: Observing SpectraSpectroscopic Observation #1: Observing Spectra
Spectroscopic Observation #1: Observing SpectraSpectroscopic Observation #1: Observing Spectra
Spectroscopic Observation #1: Observing Spectra
Students observe common light sources, record their spectra and compare their findings
with fellow classroom scientists.
••
••
•
Spectroscopic Observation #2: Mystery Gas TubesSpectroscopic Observation #2: Mystery Gas Tubes
Spectroscopic Observation #2: Mystery Gas TubesSpectroscopic Observation #2: Mystery Gas Tubes
Spectroscopic Observation #2: Mystery Gas Tubes
Teacher purchases in advance 3 - 5 gas tubes (recommended helium, hydrogen, mercury,
neon and water). Do not tell the students what gas is found in each gas tube. Have stu-
dents observe each tube using their spectroscopes and record their findings. Then, have
the students compare each spectrum with the
Spectra Reference Chart
(located on the
Web site or available to be printed on a color printer from this PDF file). Students can next
determine which gas is contained in each tube by comparing the spectra they observe and
record to the reference chart.
••
••
•
Spectroscopic Observation #3: Solar SpectrumSpectroscopic Observation #3: Solar Spectrum
Spectroscopic Observation #3: Solar SpectrumSpectroscopic Observation #3: Solar Spectrum
Spectroscopic Observation #3: Solar Spectrum
Have students observe sunlight through their spectroscopes by using a white wall to reflect
the sun’s light.
Do NOT have students view the sun directly through their spectroscopes.Do NOT have students view the sun directly through their spectroscopes.
Do NOT have students view the sun directly through their spectroscopes.Do NOT have students view the sun directly through their spectroscopes.
Do NOT have students view the sun directly through their spectroscopes.
Students record the solar spectrum. Next, have students compare their solar spectrum with
an actual solar spectrum from the
Spectra Reference Chart.
These will be different simply
because of the difference in quality between the homemade device and the more precise
scientific instrument. Then, review with the students the directions on how to identify ele-
ments in the solar spectrum from the Student Guideheet:
Solar Spectrum.
Finally, have the
students follow the same procedure and attempt to determine the other elements found in
the sun.

22
Career Exploration Guidesheet
Career Explorations
After viewing the Web cast or after reading a brief introduction on the Web site
http://solar-center.stanford.edu
of each of the careers represented, the students should be able to make a comparison
between two of the careers highlighted on the Web site.
Students choose two of the careers and place each in the box at the top of the chart. In the
box in the middle, students relate 3 ways in which these careers are similar. In the two
boxes at the lower half of the page, the students will relate 3 ways in which each career is
different from the other and select the appropriate criteria. For example, choosing solar
scientist and forensic scientist a criterion for a difference would be the object each studies.
• Student Worksheet:
Our Sun is a Special Star
• Student Worksheet:
The Electromagnetic Spectrum
• Science Exploration Guidesheet:
Spectroscopic Observation #3

24
Student Worksheet
Our Sun is a Special Star - Key
DirectionsDirections
DirectionsDirections
Directions: After reviewing the reading “Our Sun is a Special Star”, answer the questions below.
1. What is a star?
A star is a sphere of hot, glowing gases.
2. What is the sun?
A star which is a sphere of hot, glowing gases.
3. Draw a picture that shows a star, the sun and the earth if they were placed next to each other
in order of largest to smallest.
STAR SUN EARTH
4. Explain why the sun does not look like other stars.
Because the sun is closer to the Earth than any other star it looks much larger and appears
much brighter than the other stars in the sky.
5. What kind of energy does the sun give off?
The sun gives off energy we can see (visible light) and energy we cannot see (gamma rays, x-
rays, infrared rays).
6. What does a star’s spectrum tell scientists about itself?
A star’s spectrum tells scientist what elements are being used for fuel inside the star. This
information can tell a scientist about the star’s age, its temperature and its life cycle.

25
Student Worksheet
The Electromagnetic Spectrum - Key
DirectionsDirections
DirectionsDirections
Directions: After absorbing the enlightened words from the reading about the electromagnetic
spectrum, answer the questions below.
1. List the different types of light form the electromagnetic spectrum that cannot be seen by the eye.
Radio, microwaves, infrared, ultraviolet, x-ray, gamma rays
2. In the first box, draw a radio wave. In the second box, draw an x-ray wave. Tell how a radio
wave is different from an x-ray.
Tell how they are different:
Radio waves have low-energy photons that give off a longer wavelength with a lower fre-
quency. X-rays have high-energy photons that give off a shorter wavelength with a higher
frequency.
3. Explain in your own words how light is generated. Create a drawing to show your
explanation.
Electrons whirling about an atom absorb incoming energy. This causes them to reach a level of
excitation. The electrons spontaneously release the same amount of energy absorbed in the form of
photons. The amount of energy of the photons released will determine the type of light.

26
Science Exploration Guidesheet
Spectroscopic Observation #3:
Solar Spectrum - Key for page 2 only
Follow this same procedure to compare the other elements found on the
Spectra Reference Chart
to the Solar Spectrum and list below the elements that the sun is burning. Then, draw the emission
spectrum for each element given.
1. hydrogen
2. helium
3. sodium
4. ___________________

Grades 5 - 8
• Student Reading:
Our Sun is a Special Star
• Student Worksheet:
Our Sun is a Special Star
• Student Reading:
The Electromagnetic Spectrum
• Student Worksheet:
The Electromagnetic Spectrum
• Student Reading:
Spectroscopy: Star Light, Star Bright
• Science Exploration Guidesheet:
Sizing Up the Stars
• Science Exploration Guidesheet:
From a Distance
• Science Exploration Guidesheet:
Spectroscopic Observation #1:
Observing Spectra
• Science Exploration Guidesheet:
Spectroscopic Observation #2:
Mystery Gas Tube
• Science Exploration Guidesheet:
Spectroscopic Observation #3:
Solar Spectrum
• Career Exploration Guidesheet:
Compare Two Careers

28
Student Reading
Our Sun is a Special Star
Look up at the night sky and what would you see? You would see many
small points of light that we call stars. A star is actually a huge sphere
many times larger than Earth. A star is a big ball of hot, glowing
gases.
Look up at the sky during the day and what would you see? Of the
many things in the sky, you would notice the sun. The sun is the biggest
and brightest object in the sky during the day. The sun is a huge sphere
many times the size of the Earth. The sun is a big ball of hot, glowing gases.
The sun is a star. The sun is not the biggest or brightest star. It is really quite small and ordinary
compared to the many other stars. It only looks like the biggest and brightest star because it is the
closest star to Earth. The sun is about 93 million miles away from the Earth. The second closest
star is 300,000 times farther away from earth than the sun.
The sun gives off lots of energy. It gives off energy we can see and energy we cannot see. The
energy we can see is called white light. Scientists use this white light to learn more about the sun.
The white light can be bent or refracted. When white light is refracted it gives us the colors of a
rainbow. We call this rainbow a spectrum.
The bands of color in a spectrum always follow the same order: red, orange, yellow, green, blue,
indigo and violet. This order occurs because of each color’s frequency. Within the visible spec-
trum, red has the lowest frequency and violet has the highest. Some of the color bands might not
be as wide as others. Sometimes a color might not even appear. This is caused by the chemical
element that is being burned. Each star’s spectrum is different depending upon what elements are
found inside the star.
A star’s spectrum is a lot like a person’s fingerprint. Each star’s spectrum gives a unique color
pattern that only that star has. Much like people and their fingerprints because no two people
have the exact same fingerprint pattern. By carefully studying a star’s spectrum, scientists can tell
what gases and elements the star is burning. The sun’s spectrum shows scientists that it is burning
mainly hydrogen and helium.
Even though the sun is the largest object in the sky, it is really a small, ordinary star. It is special to
us because it is the closest star to Earth, and gives us light.
SS
SS
S
TUDENTSTUDENTS
TUDENTSTUDENTS
TUDENTS: NEVER LOOK DIRECTLY AT THE SUN!

29
Student Worksheet
Our Sun is a Special Star
DirectionsDirections
DirectionsDirections
Directions: After reviewing the reading “Our Sun is a Special Star”, answer the questions below.
1. What is a star?
2. What is the sun?
3. Draw a picture that shows a star, the sun and the earth if they were placed next to each other
in order of largest to smallest.
4. Explain why the sun does not appear the same as other stars.
5. What kind of energy does the sun give off?
6. What does a star’s spectrum tell scientists about itself?

30
Student Reading
The Electromagnetic Spectrum
The Excitement of Light
There is more to light than what is visible. We think of light as the visible spectrum which is white
light and its colors caused by its refraction (red, orange, yellow, green, blue, indigo and violet).
There is also, light that is invisible: radio waves, microwaves, x-rays, infrared rays, ultraviolet
rays and gamma rays. Both forms of light begin in atoms with those tiny electrons moving about
each nucleus. Electrons carry a specific amount of energy. Electrons can also, absorb more
energy and release it later. As a neutral atom absorbs more energy in its electrons, it becomes
excited. Later, this excited atom’s electrons will release the absorbed energy in the form of a very
tiny packet called a photon. This photon carries only exactly the extra energy that the electron
had absorbed—no less, no more.
Light is made up on these photons. Think of light as being a stream of these photons. Some
photons have more energy than other photons. It depends on how much energy its
electron absorbed and then, released. The amount of energy in a photon will
determine what kind of light wave is being given off. For example, high-
energy photons will produce x-rays. Moderate-energy photons will
give off visible light. Low-energy photons will give off radio
waves.
Riding the Waves
Light waves are electromagnetic waves. Light waves do not need a medium, or substance, through
which to travel. This means they can travel through the vacuum of space, unlike sound waves
which need a medium like air or water in order to move. As the stream of photons move,
they generate electric and magnetic fields. All light waves are trans-
verse waves. That means that the direction of these moving photons
is at right angles to the electric and magnetic fields. Just like a sound
wave, light waves can be measured by amplitude, wavelength and
frequency. The slower the frequency (or lower the hertz number) the
less energetic the wave. For example, the visible spectrum has red at one
end and violet at the other end of the spectrum. Red light has the lowest fre-
quency of all the colors. As you move from red light through the spectrum to violet light, the
frequency of the light wave increases. Violet has the greatest frequency and the greatest energy.
In measurable terms of hertz (Hz) the visible spectrum contains light waves with frequencies
between 400 trillion and 750 trillion hertz.

31
Student Reading
The Electromagnetic Spectrum (continued)
Covering the Full Spectrum
Scientists organize the different forms of light by frequency and wavelength. They arrange these
different types of light from lowest to highest frequency. Take a look at the Electromagnetic Spec-
trum below. Notice that radio waves are located on the left. The photons of these waves do not
have a lot of energy. They are low frequency waves with a long wavelength. AM radio waves
have a lower frequency than FM waves. Higher frequencies are needed for television signals. Up
the frequency some more and we would have microwaves. Ultraviolet radiation is rated just below
the visible spectrum’s frequencies. These harmful waves cannot be seen. Most of the ultraviolet
radiation which comes from the Sun is absorbed in the Earth’s upper atmosphere. On the other
side of the visible spectrum are the high frequency waves with greater energy levels. Here we find
the dangerous, unseen rays of x-rays and gamma rays.
Scientists use the full electromagnetic spectrum to learn more about the sun and the stars. For
example, radio waves tell scientists about the gases in our galaxy and give details about magnetic
fields in space. Ultraviolet light studies have mapped the hot gases found throughout the universe.
Most of what astronomers have learned about the sun and stars has been contained in the elec-
tromagnetic radiation that has traveled to Earth.

32
Student Worksheet
The Electromagnetic Spectrum
DirectionsDirections
DirectionsDirections
Directions: After absorbing the enlightened words from the reading about the electromagnetic
spectrum, answer the questions below.
1. List the different types of light form the electromagnetic spectrum that cannot be seen by the eye.
2. In the first box, draw a radio wave. In the second box, draw an x-ray wave. Tell how a radio
wave is different from an x-ray.
Radio waveRadio wave
Radio waveRadio wave
Radio wave
X-rayX-ray
X-rayX-ray
X-ray
Tell how they are different:Tell how they are different:
Tell how they are different:Tell how they are different:
Tell how they are different:
3. Explain in your own words how light is generated. Create a drawing to show your
explanation.

33
Student Reading
Spectroscopy: Starlight, Star Bright
Spectroscopes are important tools for astronomy. They enable astronomers to analyze
starlight (and sunlight) by providing a measure of the relative amounts of red and blue
light a star gives off. Knowing this, astronomers can determine a star’s temperature.
They can also deduce its chemical composition simply by observing and analyzing its
light.
Starlight is made up of photons. These photons originate from the inside of a star.
There, pressures are enormous and nuclear fusion is triggered. Intense radiation is
produced as atoms, consisting of a nucleus surrounded by one or more electrons,
collide with each other millions of times each second. The number of collisions de-
pends on the temperature of the gas inside the star. The higher the temperature, the
greater the rate of collisions.
Because of these collisions, many electrons are boosted to higher energy levels, a
process called excitation. The electrons spontaneously drop back to their original
energy level. In doing so, they release energy as photons. This is what happens to the
filament of an electric light bulb or to an iron bar when it is heated in a furnace. As
the temperature of the filament rises, it begins to radiate reddish light. When the
filament becomes even hotter, it radiates a bluish light. Thus, the color it radiates is an
indicator of the filament’s temperature. Stars that radiate a great amount of red light
are much cooler than stars that radiate a great amount of blue light. Stellar spectra
therefore can be used as a star thermometer.
One of the important applications of spectroscopes is their use for identifying chemical
elements. Each chemical element radiates light in specific wavelength combinations
that are as distinctive as fingerprints. Knowing the “spectral fingerprint” of each
element enables astronomers to identify the elements present in distant stars by ana-
lyzing their spectra.
There are 3 kinds of spectra: continuous, absorption and emission.
When observed through a spectroscope, the continuous spectrum appears as a continuous band
of color ranging from red to violet.

34
Student Reading
Spectroscopy: Starlight, Star Bright (continued)
An absorption spectrum happens when the light from a star passes through a cloud of gas before
reaching the spectroscope. For example, let’s say that light from a star passes through a cloud of
hydrogen gas before reaching the spectroscope. Some of the wavelengths of light will be ab-
sorbed by the hydrogen atoms. This absorption will produce a spectrum that has a broad band of
color interrupted by dark lines. These dark lines represent the certain wavelengths of light that
were absorbed by the hydrogen cloud.
An emission spectrum is observed when energy is absorbed by the gas atoms in a nebula and is
reradiated by those atoms at specific wavelengths. This spectrum consists of bright lines against a
black background. The light from fluorescent tubes and neon lights produce emission spectra.

35
Student Reading
Spectroscopy: Starlight, Star Bright (continued)
Stellar spectra allow astronomers to determine a star’s temperature and its chemical composition.
This enables astronomers to classify stars into spectral categories, estimate their age and
postulate their life cycle. When available, astronomers prefer stellar spectra collected by orbiting
spacecraft over spectra collected by Earth-based telescopes. The Earth’s atmosphere acts as a
filter and can give inaccurate readings. Orbiting spacecraft are not affected by the Earth’s
atmosphere because they orbit above the atmosphere. These orbiting spectroscopes can also
collect infrared, ultraviolet, x-ray and gamma ray bands that simply do not reach spectroscopes
on the ground.

36
Science Exploration Guidesheet
Sizing Up the Stars
DirectionsDirections
DirectionsDirections
Directions: Follow each step below and answer the questions.
1. Take both round objects your teacher gives you and place them on a flat surface 30 cm apart
and 1 meter from the observation point. See diagram below. Please, note that the observer
must be able to place his/her eyes at eye level with the round objects for this activity.
2. Placing your eyes at eye level to the two round objects, observe the apparent size of each
object to the other. Do they appear to be the same size?
3. Leaving the round object on the left in the same position, move the round object on the right so
that it appears smaller than the round object on the left. Measure the placement of both round
objects and record it below on the diagram.
4. Leaving the round object on the left in the same position, move the round object on the right so
that it appears larger than the round object on the left. Measure the placement of both round
objects and record it below on the diagram.
5. Using what you have learned from steps 3 and 4, replace one of the round objects with a
smaller round object. In order for the smaller round object to appear the same size as the
larger round object, predict what the placement of both round objects would be by drawing a
picture of it below.

37
Science Exploration Guidesheet
Sizing Up the Stars (continued)
6. Place both round objects in such a way that the smaller round object appears the same size as
the larger round object. Measure the placement of both round objects and record it below on
the diagram. Was your prediction correct?
7. Use what you have learned from steps 3 and 4 and the same two different sized round
objects for this next step. In order for the smaller round object to appear larger than the
larger round object, predict what the placement of both round objects would be by drawing a
picture of it below.
8. Place both round objects in such a way that the smaller round object appears larger than the
larger round object. Measure the placement of both round objects and record it below on the
diagram. Was your prediction correct?
9. Explain how it is possible that the sun in our solar system can actually be smaller than some of
the stars visible in the night sky.

38
Science Exploration Guidesheet
From a Distance
Directions:Directions:
Directions:Directions:
Directions: Follow each step and answer the questions as you explore the Mystery Box Light
source.
1. Look into the box and draw a diagram of what you observe. Label parts of your diagram.
Underneath your drawing make 3 observations that are not found in your diagram.
2. What do you think is the energy source of this light? Based only upon your observation, ex-
plain why you think that is.
3. Share your diagrams and observations within your group.
4. Individually, record 3 questions you have about this mystery light source that cannot be an-
swered by your recent observations.
5. Share these questions in your group and record the questions on a large sheet of paper. Post
the paper and with the class discuss which questions will be investigated.

39
Science Exploration Guidesheet
From a Distance (continued)
6. After your teacher assigns your group your question(s), brainstorm within your group the
design of a special instrument that would help your group gather data that will answer the
question(s).
7. In the space below, diagram and label the new instrument design. Give a brief explanation of
how it works and what kind of data it will give. Include a list of the materials needed to make
this special instrument.

40
Student Guidesheet
Make Your Own Spectroscope

41
Science Exploration Guidesheet
Spectroscopic Observation #1: Observing Spectra
DirectionsDirections
DirectionsDirections
Directions: Use your spectroscope to observe and record the spectrum for 3 light sources given
below. Then choose 2 light sources of your own (for example: streetlight, neon sign
light, Television light, computer monitor screen light) and record your spectroscopic
observations. Do NOT choose the sun for this activity. When you’re finished com-
pare your results with your classroom scientists.
1.1.
1.1.
1.
Light Source: fluorescent lights in the classroomLight Source: fluorescent lights in the classroom
Light Source: fluorescent lights in the classroomLight Source: fluorescent lights in the classroom
Light Source: fluorescent lights in the classroom
2.2.
2.2.
2.
Light Source: soft-white lightbulbLight Source: soft-white lightbulb
Light Source: soft-white lightbulbLight Source: soft-white lightbulb
Light Source: soft-white lightbulb
3.3.
3.3.
3.
Light Source: ____________________________Light Source: ____________________________
Light Source: ____________________________Light Source: ____________________________
Light Source: ____________________________
44
44
4
..
..
.
Light Source: ____________________________Light Source: ____________________________
Light Source: ____________________________Light Source: ____________________________
Light Source: ____________________________
Red Orange Yellow Green Blue Violet
7000 A 6000 A 5000 A 4000 A
Red Orange Yellow Green Blue Violet
7000 A 6000 A 5000 A 4000 A
Red Orange Yellow Green Blue Violet
7000 A 6000 A 5000 A 4000 A
Red Orange Yellow Green Blue Violet
7000 A 6000 A 5000 A 4000 A

42
Science Exploration Guidesheet
Spectroscopic Observation #2: Mystery Gas Tubes
DirectionsDirections
DirectionsDirections
Directions: Observe and record using your spectroscope the spectrum for each mystery gas
tube. Then use the
Spectra Reference Chart
to identify what element is in each tube.
1.1.
1.1.
1.
Mystery Gas Tube #1: ____________________________Mystery Gas Tube #1: ____________________________
Mystery Gas Tube #1: ____________________________Mystery Gas Tube #1: ____________________________
Mystery Gas Tube #1: ____________________________
2.2.
2.2.
2.
Mystery Gas Tube #2: ____________________________Mystery Gas Tube #2: ____________________________
Mystery Gas Tube #2: ____________________________Mystery Gas Tube #2: ____________________________
Mystery Gas Tube #2: ____________________________
3.3.
3.3.
3.
Mystery Gas Tube #3: ____________________________Mystery Gas Tube #3: ____________________________
Mystery Gas Tube #3: ____________________________Mystery Gas Tube #3: ____________________________
Mystery Gas Tube #3: ____________________________
4.4.
4.4.
4.
Mystery Gas Tube #4: ____________________________Mystery Gas Tube #4: ____________________________
Mystery Gas Tube #4: ____________________________Mystery Gas Tube #4: ____________________________
Mystery Gas Tube #4: ____________________________
5.5.
5.5.
5.
Mystery Gas Tube #5: ____________________________Mystery Gas Tube #5: ____________________________
Mystery Gas Tube #5: ____________________________Mystery Gas Tube #5: ____________________________
Mystery Gas Tube #5: ____________________________
Red Orange Yellow Green Blue Violet
7000 A 6000 A 5000 A 4000 A
Red Orange Yellow Green Blue Violet
7000 A 6000 A 5000 A 4000 A
Red Orange Yellow Green Blue Violet
7000 A 6000 A 5000 A 4000 A
Red Orange Yellow Green Blue Violet
7000 A 6000 A 5000 A 4000 A
Red Orange Yellow Green Blue Violet
7000 A 6000 A 5000 A 4000 A

43
Science Exploration Guidesheet
Spectra Reference Chart

44
Science Exploration Guidesheet
Spectroscopic Observation #3: Solar Spectrum
To figure out what elements a star is burning for fuel, scientists compare a star’s absorption
spectrum to the emission spectrum of an element found on earth. Let’s look at the Sun’s Spectrum.
Notice where the dark lines occur. Note the number and color where the dark lines are located.
Next, look at the emission spectrum for hydrogen. Look closely at the red and blue lines.
Is the red line located in the same place on the hydrogen spectrum as a dark line in the red area
of the solar spectrum?
Is the thick, blue line in the same place on the hydrogen spectrum as a thick, dark line in the blue
area of the solar spectrum?
Is the thin, blue line in the same place on the hydrogen spectrum as a thin, dark line in the blue
area of the solar spectrum?
You should have answered “yes” to all three questions.
So, if the colored lines from the helium spectrum match exactly to the location of the black lines in
the same colored areas on the solar spectrum, then that means that the sun is burning hydrogen.

45
Science Exploration Guidesheet
Spectroscopic Observation #3: Solar Spectrum (continued)
Follow this same procedure to compare the other elements found on the
Spectra Reference Chart
to the Solar Spectrum and list below the elements that the sun is burning. Then, draw the emission
spectrum for each element given.
1.1.
1.1.
1.
hydrogenhydrogen
hydrogenhydrogen
hydrogen
2.2.
2.2.
2.
___________________ ___________________
___________________ ___________________
___________________
3.3.
3.3.
3.
___________________ ___________________
___________________ ___________________
___________________
4.4.
4.4.
4.
___________________ ___________________
___________________ ___________________
___________________
Red Orange Yellow Green Blue Violet
7000 A 6000 A 5000 A 4000 A
Red Orange Yellow Green Blue Violet
7000 A 6000 A 5000 A 4000 A
Red Orange Yellow Green Blue Violet
7000 A 6000 A 5000 A 4000 A
Red Orange Yellow Green Blue Violet
7000 A 6000 A 5000 A 4000 A

46
Career Exploration Guidesheet
Career Comparison
DirectionsDirections
DirectionsDirections
Directions: Choose 2 of the careers covered on the Web site http://solar-center.stanford.edu
or during the Webcast, and list 3 ways in which the two careers are similar and 3
ways in which the two careers are different.
careercareer
careercareer
career
careercareer
careercareer
career
How Are They Alike?How Are They Alike?
How Are They Alike?How Are They Alike?
How Are They Alike?
In What Ways Are They Different?In What Ways Are They Different?
In What Ways Are They Different?In What Ways Are They Different?
In What Ways Are They Different?

• Solar Glossary
• Web Work

48
Appendix
Solar Glossary
DirectionsDirections
DirectionsDirections
Directions: An interactive vocabulary crossword puzzle and word search can be found on the
Web site: http://solar-center.stanford.edu using the following words and their
definitions.
AngstromAngstrom
AngstromAngstrom
Angstrom an unit of measure equal to 10 meters
electromagnetic radiationelectromagnetic radiation
electromagnetic radiationelectromagnetic radiation
electromagnetic radiation
the transfer of energy by the swinging back and forth of
electromagnetic fields
electromagnetic spectrumelectromagnetic spectrum
electromagnetic spectrumelectromagnetic spectrum
electromagnetic spectrum
The wide band of energy from the sun which consists of
invisible rays and visible light. See diagram below.
elementelement
elementelement
element a substance that cannot by chemical means be decomposed
into simpler substances
heliumhelium
heliumhelium
helium a lighter-than-air gas that is a chemical element
hydrogenhydrogen
hydrogenhydrogen
hydrogen a lighter-than-air gas that is highly flammable; it is a chemi-
cal element that is the lightest of all substances
infrared radiationinfrared radiation
infrared radiationinfrared radiation
infrared radiation invisible electromagnetic rays that have a longer wavelength
than visible light and is detected because of its heating effect

49
Appendix
Solar Glossary (continued)
light spectrumlight spectrum
light spectrumlight spectrum
light spectrum The array of colors (or wavelengths) obtained when white
light is refracted.
refractrefract
refractrefract
refract to bend light rays by having them pass from one transparent
medium to another. For example, passing sunlight through a
prism will cause the rays to bend as the speed at which the
light is moving is slowed. Each color ray moves at a different
speed or frequency. The highest frequency is refracted the
most with the lowest frequency being refracted the least. This
causes the white light to be split into bands of color.
ROY G BIVROY G BIV
ROY G BIVROY G BIV
ROY G BIV An acronym that helps us remember the order of the colors in
the light spectrum.
spectral analysisspectral analysis
spectral analysisspectral analysis
spectral analysis The study and analysis of the white light from celestial ob-
jects; each spectrum identifies the type of elements contained
inside the object.
SpectrographSpectrograph
SpectrographSpectrograph
Spectrograph an instrument used for dispersing and recording specific
wavelengths of the electromagnetic spectrum
SpectroscopeSpectroscope
SpectroscopeSpectroscope
Spectroscope an instrument used to form and examine
spectra
starstar
starstar
star a large sphere of hot, glowing gases that appears as a
distant pinpoint of light in the night sky
sunsun
sunsun
sun the star closest to the Earth that is a large sphere of hot,
glowing gases and gives off electromagnetic energy to the
Earth
visible lightvisible light
visible lightvisible light
visible light the part of the electromagnetic spectrum that can be seen by
the human eye
wave frequencywave frequency
wave frequencywave frequency
wave frequency the number of times a wave crest passes a point in a second
wavelengthwavelength
wavelengthwavelength
wavelength the distance between 2 successive wave crests

50
Appendix
Web Work
http://solar-center.stanford.edu/http://solar-center.stanford.edu/
http://solar-center.stanford.edu/http://solar-center.stanford.edu/
http://solar-center.stanford.edu/
This site contains an interactive vocabulary crossword puzzle and word search using the solar
glossary words. It also has an interactive explanation of the electromagnetic spectrum. Celestial
spectra are also available to be viewed and analyzed in conjunction with the Science Explora-
tions:
Spectroscopic Observations
and
Reading a Spectrum.
http://image.gsfc.nasa.gov/poetryhttp://image.gsfc.nasa.gov/poetry
http://image.gsfc.nasa.gov/poetryhttp://image.gsfc.nasa.gov/poetry
http://image.gsfc.nasa.gov/poetry
Both teachers and students can use this site for lots of easy-to-understand information about the
sun and various research missions that have collected much data about the sun. Teachers will find
additional classroom activities and resources useful for their students. The “Multimedia” button
offers informative animations and video footage that illustrates concepts about the sun.
http://helios.gsfc.nasa.gov/http://helios.gsfc.nasa.gov/
http://helios.gsfc.nasa.gov/http://helios.gsfc.nasa.gov/
http://helios.gsfc.nasa.gov/
An upper middle school to high school level Web site that offers grade-level appropriate text with
informative diagrams. This is a good resource for both teachers and students.
http://www.passporttoknowledge.com/sun/earth/sun_earth.htmlhttp://www.passporttoknowledge.com/sun/earth/sun_earth.html
http://www.passporttoknowledge.com/sun/earth/sun_earth.htmlhttp://www.passporttoknowledge.com/sun/earth/sun_earth.html
http://www.passporttoknowledge.com/sun/earth/sun_earth.html
This site offers even more helpful solar resources.
http://www.websites.noaa.gov/index/htmlhttp://www.websites.noaa.gov/index/html
http://www.websites.noaa.gov/index/htmlhttp://www.websites.noaa.gov/index/html
http://www.websites.noaa.gov/index/html
The weather service also provides information on the latest solar image and gives “space weather
reports” in the form of a solar-geophysical forecast. It offers excellent data that is graphed and
archived.
