
Using TimeMap
• Navigating TimeMap
• Getting Started
• Working with Timelines
• Importing Data
• Customizing Timelines
• Arranging Timeline Elements
• Editing Timelines
• Creating Presentations
• Printing Timelines
• Exporting Data
• Managing File Viewers
• Managing TimeMap Options
• Using Keyboard Shortcuts
User Guide
TimeMap®, Version 6.0
No part of this work may be reproduced or transmitted in any form or by any means, electronic or mechanical, including
photocopying, recording, or by any information storage or retrieval system, without permission.
While the information contained herein is believed to be accurate, this work is provided "as is," without warranty of any
kind. The information contained in this work does not constitute, and is not intended as, legal advice.
LexisNexis and the Knowledge Burst are registered trademarks of Reed Elsevier Properties Inc., used under license.
TimeMap is a registered trademark of LexisNexis, a division of RELX Inc. Other products or services may be trademarks or
registered trademarks of their respective companies.
© 2017 LexisNexis. All rights reserved.
CaseMap®
CaseMap® Server
TextMap®
TimeMap®
Sanction®
Concordance®
Version: TimeMap® 6.0
Release Date: April 17, 2017
TimeMap User Guide

3Contents
3
© 2017 LexisNexis. All rights reserved.
Table of Contents
Chapter 1
Using TimeMap
7
................................................................................................................................... 7
1 Navigating TimeMap
.......................................................................................................................................................... 7
Navigating TimeMap
.......................................................................................................................................................... 8
Modifying the Navigation pane
.......................................................................................................................................................... 10
About the title and status bars
.......................................................................................................................................................... 11
About TimeMap toolbar buttons
.......................................................................................................................................................... 15
Changing toolbar buttons and settings
.......................................................................................................................................................... 16
About TimeMap menus
................................................................................................................................... 19
2 Getting Started
.......................................................................................................................................................... 19
About the Getting Started pane
.......................................................................................................................................................... 21
Practicing with sample data
.......................................................................................................................................................... 21
TimeMap Quick Start tutorial
.......................................................................................................................................................... 24
Opening timelines
................................................................................................................................... 24
3 Working with Timelines
.......................................................................................................................................................... 24
About timelines
.......................................................................................................................................................... 27
Creating and saving timelines
.......................................................................................................................................................... 28
Adding a timeline title
.......................................................................................................................................................... 29
Adding title and introduction pages
.......................................................................................................................................................... 32
Using the Fact Design Gallery
.......................................................................................................................................................... 37
Adding fact boxes
.......................................................................................................................................................... 40
Entering dates and times
.......................................................................................................................................................... 44
Adding text boxes
.......................................................................................................................................................... 46
Adding pictures and clip art
.......................................................................................................................................................... 51
Adding linked files
.......................................................................................................................................................... 53
Creating templates
.......................................................................................................................................................... 56
Selecting timeline elements
.......................................................................................................................................................... 57
Resizing timeline elements
.......................................................................................................................................................... 57
Copying timeline elements
.......................................................................................................................................................... 58
Deleting timeline elements
.......................................................................................................................................................... 59
Deleting timelines
................................................................................................................................... 60
4 Importing Data
.......................................................................................................................................................... 60
Send facts from CaseMap
.......................................................................................................................................................... 61
Importing text into timelines
................................................................................................................................... 64
5 Customizing Timelines
.......................................................................................................................................................... 64
Using the Fact Design Gallery
.......................................................................................................................................................... 69
Changing fact box direction
.......................................................................................................................................................... 70
Customizing timeline elements
......................................................................................................................................................... 70About customizing timeline elements
......................................................................................................................................................... 71Changing text fonts and styles
......................................................................................................................................................... 72Changing date fonts in fact boxes
......................................................................................................................................................... 74Changing display options in fact boxes
......................................................................................................................................................... 75Changing date alignment in fact boxes
......................................................................................................................................................... 75Customizing the date with text
......................................................................................................................................................... 76Changing the fill color
......................................................................................................................................................... 78Changing the border color and style
......................................................................................................................................................... 79Changing layout settings

TimeMap4
© 2017 LexisNexis. All rights reserved.
......................................................................................................................................................... 80Changing linked files
.......................................................................................................................................................... 81
Applying formatting to timeline elements
.......................................................................................................................................................... 82
Changing the timeline background color
.......................................................................................................................................................... 82
Changing timeline default settings
................................................................................................................................... 83
6 Customizing the Time Scale
.......................................................................................................................................................... 83
Inserting time scale breaks
.......................................................................................................................................................... 86
Moving the time scale
.......................................................................................................................................................... 87
Changing time scale width
.......................................................................................................................................................... 88
Changing time scale begin/end dates
.......................................................................................................................................................... 90
Changing the time scale font
.......................................................................................................................................................... 91
Changing time scale date format
.......................................................................................................................................................... 92
Changing the time scale style
.......................................................................................................................................................... 94
Changing time scale color
................................................................................................................................... 95
7 Arranging Timeline Elements
.......................................................................................................................................................... 95
Moving timeline elements
.......................................................................................................................................................... 95
Positioning timeline elements
.......................................................................................................................................................... 97
Anchoring text boxes
.......................................................................................................................................................... 99
Using the Auto-Arrange feature
.......................................................................................................................................................... 100
Using the Auto-Stack feature
.......................................................................................................................................................... 100
Comparing Auto-Arrange vs Auto-Stack
.......................................................................................................................................................... 101
Managing overlapping fact boxes
................................................................................................................................... 103
8 Editing Timelines
.......................................................................................................................................................... 103
Using spelling tools
.......................................................................................................................................................... 106
Finding and replacing data
.......................................................................................................................................................... 108
Copying fact boxes to new timelines
................................................................................................................................... 109
9 Creating Presentations
.......................................................................................................................................................... 109
Working in presentation mode
................................................................................................................................... 110
10 Printing and Saving Timelines
.......................................................................................................................................................... 110
About printing timelines
.......................................................................................................................................................... 112
Printing a multi-page timeline banner
.......................................................................................................................................................... 113
Printing and saving timelines to PDF
.......................................................................................................................................................... 114
Saving timelines as image files
.......................................................................................................................................................... 115
Saving timelines to make charts
................................................................................................................................... 116
11 Exporting Data
.......................................................................................................................................................... 116
Emailing timelines
.......................................................................................................................................................... 117
Send to Sanction 2.x
.......................................................................................................................................................... 119
Send to Sanction 3.5 or later
.......................................................................................................................................................... 123
Send to PowerPoint
.......................................................................................................................................................... 127
Send to CaseMap
.......................................................................................................................................................... 128
Copying timelines into word processing applications
................................................................................................................................... 129
12 Managing File Viewers
.......................................................................................................................................................... 129
About file viewers
.......................................................................................................................................................... 130
Adding/changing file viewers
.......................................................................................................................................................... 132
Setting up custom file viewers
................................................................................................................................... 136
13 Managing TimeMap Options
.......................................................................................................................................................... 136
Customizing TimeMap options
.......................................................................................................................................................... 138
Changing accessibility options
.......................................................................................................................................................... 139
Backing up timelines
................................................................................................................................... 140
14 Using Keyboard Shortcuts
.......................................................................................................................................................... 140
Using keyboard shortcuts
.......................................................................................................................................................... 141
Customizing keyboard shortcuts

5Contents
5
© 2017 LexisNexis. All rights reserved.
Index 143

Chapter
1
Using TimeMap
Using TimeMap
User Guide

Using TimeMap 7
© 2017 LexisNexis. All rights reserved.
Using TimeMap
Navigating TimeMap
Navigating TimeMap
TimeMap's user interface is designed so your timeline chart displays in the primary workspace
pane for maximum viewing. This workspace pane is where you will add fact information in facts
boxes, add text boxes and pictures or graphics to your timeline. The workspace pane has two
views: Timeline View and Spreadsheet View. Timeline View displays your timeline in visual
graph form as you would present it to an audience. Spreadsheet View displays your timeline
elements in spreadsheet rows so you can view text content, dates, and any linked files easily.
To assist you in customizing your timeline elements, you will use the navigation pane on the left
side of the application. The navigation pane has two interchangeable panes: Add New Facts
and Box Line Defaults. Clicking on the Apply Facts Styles bar allows you to apply formatting
styles to fact boxes.
To view the number key
1. Ribbons
The Ribbons (Home, Time Scale and View) contain menu items and other commands for

TimeMap8
© 2017 LexisNexis. All rights reserved.
performing TimeMap tasks.
Two additional ribbons (Box Tools and Spreadsheet Tools) contain menus and buttons
for fact management and formatting options.
See About TimeMap menus for additional information.
2. Navigation Pane
The Standard Toolbar contains buttons that let you add and format delete fact and text
boxes, adjust the time scale, format fonts and dates, access box properties, and more.
Some buttons only activate with certain spreadsheets.
The Navigation pane runs vertically along the left side of TimeMap and provides access to
two different panes: Add New Facts and Box Line Defaults. Click on the Navigation bars
at the bottom of the pane to access each set of tools.
Add New Facts — The Add New Facts pane displays a variety of pre-formatted fact box
styles you can use and also lists any custom styles you have created.
For more information, see Using the Fact Design Gallery.
Apply Fact Styles — Click the Apply Fact Styles bar to toggle this tool on or off. When
the bar is highlighted, select the fact or text box for which you want to change a style,
click on a style in the Fact Design Gallery, then click OK in the message.
Box Line Defaults — The Box Line Defaults pane allows you to modify the default styles
applied to new fact and text boxes.
For more information, see Using the Fact Design Gallery.
3. Workspace
Displays your timeline in either Timeline or Spreadsheet view. These views are where
you will enter, modify, and track your timeline data.
Related Topics
Modifying navigation pane display
About the title and status bars
Modifying the Navigation pane
You can re-size or hide the display of the navigation pane to suit your viewing preferences.
To maximize navigation pane for better viewing

Using TimeMap 9
© 2017 LexisNexis. All rights reserved.
To change the width of the Navigation pane, drag the split bars to the left or right, or up and
down.
As you pull the bottom split bar down, the Navigation pane buttons change into icons on the
lower button.

TimeMap10
© 2017 LexisNexis. All rights reserved.
You can also click the arrow on the lower button and select Show More Buttons or Show
Fewer Buttons to maximize the pane view.
To hide the Navigation pane to maximize your workspace
To maximize your workspace pane, click the Collapse button to pin the Navigation pane to
the left side of TimeMap. The navigation bar can easily be expanded and locked on-screen
when you need to use it more frequently.
To change the navigation pane display
To change the Navigation pane display, click the respective panel button. The text in the
active panel or tool is highlighted in blue.
Related Topics
Navigating TimeMap
About the title and status bars
About the title and status bars
TimeMap has two title bars: one for the application and one for the spreadsheet. The status
bar is on the bottom left of the TimeMap window.

Using TimeMap 11
© 2017 LexisNexis. All rights reserved.
Application title bar
TimeMap's title bar displays the name of the case you are currently viewing.
Status bar
The status bar in the bottom left corner of TimeMap provides buttons to increase/decrease
timeline pages, view or change the current page count, re-size the timeline, access Full Screen
mode, track the current Fact Count and Fact Density for the timeline.
Related Topics
Navigating TimeMap
Modifying the Navigation pane
About TimeMap toolbar buttons
TimeMap has a Quick Access toolbar to help you easily accomplish tasks. You can customize to
display which buttons you use most frequently. By default, the toolbar displays the most
commonly used buttons. Place your mouse pointer over each button to view its name.
Click on the More Buttons icon at the far right of the toolbar to view a listing of all available
buttons. Select a button in the button list to add or remove a button to or from the toolbar. All
checked buttons in the list display on the toolbar.
The toolbar submenu allows you to determine which toolbar/ribbons are displayed in TimeMap,
and customize the Quick Access toolbar, to include customizing ribbons and keyboard shortcuts
using the Customize dialog box.
To reset the toolbar to its original view, click on the More Buttons icon to view the toolbar menu,
and then select Reset at the bottom of the Ribbon Customization dialog box.

TimeMap12
© 2017 LexisNexis. All rights reserved.
Quick Access toolbar buttons
Reference the following table for a listing of the Quick Access toolbar buttons and
descriptions.

Using TimeMap 13
© 2017 LexisNexis. All rights reserved.
Placing your pointer over an icon (i.e., Quick Print) within the application provides a brief
description/use of the selected icon.
Quick Access Toolbar Buttons
Button
Name
Use
Save &
Save As
Use the Save & Save As button to Save the timeline as a Visual,
Template or Graphic.
Print
Use the Quick Print button to print the timeline to a local or
network printer.
Print to PDF
(File)
Use the Print to PDF (File) button to print to an Adobe Acrobat
PDF file. Opens the Save As PDF dialog box and allows you to
save the PDF file to a local or network directory.
Print to PDF
(Email)
Use the Print to PDF (Email) button to compile a PDF and then
opens the default email application so you can save the PDF file
as an e-mail attachment.
Undo
Use the Undo button to undo an edit.
Redo
Use the Redo button to redo an edit.
Spellcheck
Use the Spellcheck button to check spelling and grammar.
Cut
Use the Cut button to remove selected information to the
Clipboard so that you can paste it in another location on the
timeline.
Copy
Use the Copy button to copy selected information to the
Clipboard so that you can paste it into another location on the
timeline.
Paste
Use the Paste button to add content from the Clipboard onto
your timeline.
Import
Use the Import button to import facts from a text file.
Auto
Arrange
Use the Auto Arrange button to automatically reposition
existing fact boxes.
Auto Stack
Use the Auto Stack button to apply a group of commands to
improve the appearance of your timeline.
Align Left
Use the Align Left button to position the left side of all selected
elements at the same vertical position as the first element

TimeMap14
© 2017 LexisNexis. All rights reserved.
Quick Access Toolbar Buttons
Button
Name
Use
chosen.
Alight Right
Use the Align Right button to position the right side of all
selected elements at the same vertical position as the first
element chosen.
Align Top
Use the Align Top button to position the top of all selected
elements at the same vertical position as the first element
chosen.
Align
Bottom
Use the Align Bottom button to position the bottom of all
selected elements at the same vertical position as the first
element chosen.
Center
Vertically
Use the Center Vertically button to move the selected group of
elements so they are equal distance from the top and bottom
of the chart.
Center
Horizontally
Use the Center Horizontally button to move the selected group
of elements so they are equal distance from the left and right
of the chart.
Distribute
Vertically
Use the Distribute Vertically button to position the selected
elements in equal increments from the element with the
highest vertical position to the one with the lowest.
Distribute
Horizontally
Use the Distribute Horizontally button to position the selected
elements in equal increments from the element with the
highest horizontal position to the one with the lowest.
Bring to
Front
Use the Bring to Front button to place the selected element of
a layered stack of graphics or text on top.
Send to
Back
Use the Send to Back button to place the selected element of a
layered stack of graphics or text on the bottom.
Related Topics
Navigating TimeMap
Changing toolbar buttons and settings

Using TimeMap 15
© 2017 LexisNexis. All rights reserved.
Changing toolbar buttons and settings
TimeMap allows you to add and remove toolbar buttons and settings for your personal
preference.
To add/remove toolbar buttons
1. On the Quick Access toolbar, click the More Buttons icon in the upper left corner.
2. Select or deselect the buttons you want to display.
Menu items with a check mark display on the toolbar. The toolbar display is updated.
To reset to the toolbar to its original display, click Customize Quick Access Toolbar, click
Reset, and then click Reset all customizations.
To add/remove menu commands to the toolbar
1. On the Quick Access toolbar, click the More Buttons icon in the upper right corner.
You can also right-click on the Quick Access toolbar.
2. From the menu list, select one of the following:
Customize the ribbon
a. Click Customize the Ribbon.
b. In the Choose commands from area of the Ribbon Customization dialog box, select
the desired command/tab.
The Command display is updated based on the command type selected in the
previous step.
c. Under the Customize the Ribbon heading, place a check mark next to the tab(s) to be
displayed.
d. Use the applicable up or down arrow to place appropriately.
e. Optional: To add a new tab
1. Under the Customize the Ribbon heading, select the tab/area where the new tab
is to be added.
2. Click the Add button, and then click Add New Tab.
A new tab is added.
3. Click the Rename button.

TimeMap16
© 2017 LexisNexis. All rights reserved.
4. In the Display name box, enter a new name for the tab.
5. Click OK.
The new name is displayed.
6. Click OK to close the Ribbon Customization dialog box.
f. Optional: To reset customized ribbon settings
1. Click the Reset button and select:
Reset only selected tab to reset only settings for the selected tab.
Reset all customizations to reset all customized settings back to the default
system settings.
2. Click OK.
To customize toolbar
1. On the Quick Access toolbar, click the More Buttons icon in the upper right corner.
2. In the Quick Access Toolbar Customization dialog box, in the Choose commands from
area, select a command in the list.
3. Select applicable tabs, submenus, etc. and click the right arrow.
4. In the Customize Quick Access Toolbar area, use the up arrow to adjust the
placement.
5. Repeat Steps 2 - Steps 4 as applicable.
6. Click OK to save setting changes.
Related Topics
About TimeMap toolbar buttons
About TimeMap menus
About TimeMap menus
TimeMap's Menu bar (now referred to as the Main Ribbon) is located at the top left corner of
the TimeMap screen. Click on each ribbon (e.g., Home) to access the menus/commands, each
providing functionality in TimeMap.

Using TimeMap 17
© 2017 LexisNexis. All rights reserved.
The commands on each menu affect the timeline currently in view. Some options will give you
an arrow that opens a submenu or additional tools. Most of the commands also have
corresponding keyboard shortcuts. See Using Keyboard Shortcuts.
File menu
The File menu contains menu items useful in getting started and to create, import, save, and
access timeline files. From the File menu, you can also send data from TimeMap to other
applications, such as Sanction, Microsoft PowerPoint and CaseMap, as well as to an Email
recipient. Print options are also listed on this menu.
Home ribbon
The Home ribbon contains menu items that allow you edit, search, and copy timeline content,
such as Undo, Redo, Cut, Copy, Paste, Find, and Replace. Use the Go to Date command

TimeMap18
© 2017 LexisNexis. All rights reserved.
found in the Find & Select drop-down menu to quickly locate a specific date in your timeline.
This ribbon also provides access to editing of linked files, adding or changing file viewers.
Time Scale ribbon
The Time Scale ribbon contains menu items that allow you to modify time scale display for
the timeline, including increasing or decreasing the page count, expanding or compressing
the width of the time scale, insert or edit time scale breaks, modify begin/end dates and
date styles, and access time scale properties.
View ribbon
The View ribbon contains menu items that allow you to switch between the timeline or
spreadsheet view, access the Fact Design Gallery, turn on/off page breaks and grid lines,
zoom/adjust grid size, and access Full Screen presentation mode. You can also choose from
options to cascade or tile vertically or horizontally.
Box Tools Format ribbon
The Box Tools Format ribbon allows you to access timeline alignment options as well as the
Auto-Arrange or Auto-Stack tools. Additionally you have access to various formatting tools
for text fonts, date fonts and styles, and changing the chart background color. Fact flag
orientation, position and size formatting, as well as the Switch Windows menu command to
allow you to adjust your workspace view when working on multiple timelines.

Using TimeMap 19
© 2017 LexisNexis. All rights reserved.
Spreadsheet Tools ribbon
The Spreadsheet Tools ribbon contains menu items that allow you to edit, search, and copy
timeline content in the spreadsheet view, such as Cut, Copy, Paste, Find, and Replace. Use
the Go to Date command found in the Find & Select command to quickly locate a specific date
in your timeline. This ribbon also provides access to adjust row height and column width as
well as refresh to sort facts into chronological order.
Related Topics
Navigating TimeMap
Getting Started
About the Getting Started pane
The Getting Started pane displays when you open TimeMap or close a timeline. From this pane
you can access a variety of example visuals and learning resources to practice learning the
software. You can also refresh the example visuals from the Getting Started pane. If you
already have a timeline open and want to open the Getting Started pane, you can still access
this pane from the File menu.


Using TimeMap 21
© 2017 LexisNexis. All rights reserved.
Practicing with sample data
TimeMap provides you with a variety of example visuals so you can practice using the
application without using your own data. The example data is comprised of a fictitious wrongful
termination case, Hawkins v. Anstar. When experimenting with example visuals, you can feel
confident about clicking, adding, updating, and deleting data without ruining it. TimeMap has a
Refresh Example Visuals button that instantly resets the visuals to their original state so you
can start practicing a new feature.
Use the example visuals to practice adding new fact or text boxes, customizing timeline
elements, or importing facts into a timeline. Any changes you make to the example timelines
are automatically saved so you can see how the software displays and updates data.
To refresh timelines
1. On the File menu, click Close.
2. In the Getting Started pane, click the Refresh Example Visuals link.
You can now re-open example visuals and begin using them again.
Related Topics
About the Getting Started pane
About the Quick Start tutorial
TimeMap Quick Start tutorial
Opening cases
TimeMap Quick Start tutorial
The TimeMap Quick Start tutorial will help you gain a high-level understanding of the software
and how to create a timeline. You can quickly create a draft timeline to learn how the features
work. We suggest charting your family's birthdays to get started. You can also experiment with
Example Visuals, which are accessible from the Getting Started pane.
The TimeMap Quick Start tutorial is designed to help you:
Learn about TimeMap's primary features.
Gain an introduction to the tools and features you need to create a timeline and start
working in it.
Practice using the features in the Example Visuals provided in TimeMap.
Direct you to the help topics and procedures you need to accomplish initial tasks and learn
more about TimeMap.

TimeMap22
© 2017 LexisNexis. All rights reserved.
Creating timelines
1. On the Getting Started pane, click New Visual.
You can also click New on the Getting Started pane and then select whether you want
the Default Horizontal or Vertical timeline.
2. On the New Visual sub-menu, click New Horizontal or New Vertical.
The blank timeline template is now ready for you to begin working.
For more information, see About timelines and Creating and saving timelines.
Adding fact boxes
Fact Boxes are flags that denote events and connect to the time scale. Text boxes are for
titles, labels, and legends. As you add fact boxes to your timeline, TimeMap automatically
generates the time scale for you. The time scale is the timeline at the bottom of the visual.
Each time you add a new fact box, the New Fact dialog box displays for you to type in the
date and fact text. This dialog box is also where you can customize the fact box's font style,
color, and line style. You can also modify the layout of a fact box, and modify image settings
or linking files.
Add fact boxes in two views:
Timeline View allows you to see the fact boxes as you add them to the timeline (default
view).
Spreadsheet View allows you to add facts into spreadsheet fields; one fact box per
spreadsheet row.
Enter facts in either Timeline or Spreadsheet View and TimeMap automatically creates a time
scale and puts fact boxes above the corresponding fact dates. Change a fact date or add a
new fact and TimeMap automatically recalculates the time scale for you. For more
information, see Adding fact boxes and Entering dates and times.
New facts display with the default style for the template you are using (the top style that
displays in the Add New Facts pane in the Fact Design Gallery). You can apply a new style to
a new fact box or a set of selected fact boxes. You can apply new fact box styles in either
view. See About customizing timeline elements and Using the Fact Design Gallery.
In Timeline view, you can drag timeline elements to fine-tune their position. See Moving
timeline elements.
Adding text boxes

Using TimeMap 23
© 2017 LexisNexis. All rights reserved.
In addition to fact boxes or pictures, text boxes are another element you can add to your
timeline. Text boxes can be added to the timeline any where you want to include additional
information, emphasize key points, or add a timeline key.
Text boxes differ from fact boxes because they do not contain dates and do not connect to
or affect the timescale. They also do not have border or fill by default, but you can add these
style changes if you want.
For more information, see Adding text boxes.
Working with the time scale
The time scale is the timeline located at the bottom of the visual. The time scale can be
moved to another location in the timeline or customized by inserting time scale breaks to
condense gaps in the timeline. You can also customize the width and height, begin and end
dates, the font and date formats, style and color.
For more information, see Inserting time scale breaks and Moving the time scale as well as
other topics in the Customizing the Time Scale book.
Customizing timeline elements
Customize facts in either Timeline or Spreadsheet view. Customize any timeline element by
double-clicking on it. You can select multiple fact or text boxes at one time and edit style
changes all at once.
For more information, see About customizing timeline elements and Using the Fact Design
Gallery. Explore topics in both the Customizing Timelines and Customizing the TimeScale
books.
Printing and saving timelines
Printing your TimeMap timeline requires no more than clicking the Print button on the Quick
Access toolbar or choosing one of the Print options on the File menu. TimeMap uses your
page setup options to determine the paper size, orientation, and margins to use when
printing. You can also add page numbers and date and time information to your visual by
changing the layout properties within the Page Setup dialog box.
For more information, see About printing timelines, Printing a multi-page timeline banner,
Printing and saving timelines to PDF.
You can also save timelines as image files, templates, or to make charts. See Saving
timelines as image files and Saving timelines to make charts.
Once timelines are created, you can easily export the data by emailing timelines or sending it
to another program like Microsoft PowerPoint, Sanction, PowerPoint, or CaseMap. For more
information on each, see the respective topics in the Exporting Data book.
Related Topics
Practicing with sample data
Opening cases

TimeMap24
© 2017 LexisNexis. All rights reserved.
Opening timelines
When you start TimeMap, you can open an existing TimeMap timeline by selecting one that was
recently used from the list of files that displays in the Getting Started pane. As you work in
TimeMap, you can open existing timelines or create a new one by clicking the Open option on
the Getting Started pane.
To open an existing timeline
There are two ways you can open a timeline:
1. On the Getting Started pane, click Open a Visual.
Click one of the files that appear to the right of Recent Visuals, or
Click Computer and navigate to the folder where you saved the timeline file, and then
click on the file to open it in TimeMap.
2. Or click the File menu and then click Open.
Click one of the files that appear to the right of Recent Visuals, or
Click Computer and navigate to the folder where you saved the timeline file, and then
click on the file to open it in TimeMap.
To close a timeline
On the File menu, click Close.
Related Topics
About the Getting Started task pane
Practicing with sample data
TimeMap Quick Start tutorial
Creating timelines
Working with Timelines
About timelines
TimeMap contains two views that you can work in when charting your timeline. Both views
display the current Fact Count and Fact Density at the bottom of the timeline.
Timeline view

Using TimeMap 25
© 2017 LexisNexis. All rights reserved.
Timeline view displays your charted visual as you would present it to an audience. Timeline
view is also the view that is printed. Timeline view displays fact boxes, text boxes, and the
time scale as well as any added pictures or clip art.
Timeline view includes four viewing options:
Fit in Window — displays the timeline display so the entirety of your visual is in view.
This view is helpful when you want to see how the overall timeline looks even if the
elements are too small to read.
Actual Size — displays the timeline at the same size it will print. This means you are
essentially viewing one page of the timeline at a time.
Fit Height — displays the timeline so that it fits within the vertical space of your TimeMap
workspace.
Fit Width — displays the timeline so that it fits within the horizontal space of your
TimeMap workspace.
The status bar in the bottom left corner of TimeMap provides buttons to increase/decrease
timeline pages, view or change the current page count, resize the timeline view options,
access Full Screen mode, track the current Fact Count and Fact Density for the timeline.
Spreadsheet view
TimeMap's Spreadsheet view allows you to enter new fact data in a format that is similar to
working in Microsoft® Excel. At a glance, you can see which facts have linked files, select
multiple rows or specific rows for deletion or style editing, and add new facts by typing them

TimeMap26
© 2017 LexisNexis. All rights reserved.
in at the bottom of the spreadsheet.
To sort facts into chronological order, press F5 or click Refresh on the Spreadsheet Tools
ribbon. You can also sort the spreadsheet by clicking on the Date & Time (default sort) or
Fact Text column headers. To open a linked file, click the paperclip icon next to the left of the
fact. Text boxes do not display in Spreadsheet view.
You can still edit timeline element properties while working in Spreadsheet view. Right-click
on a fact row and click Properties. You can also select a fact and click the arrow in the Editing
tool on the Spreadsheet Tools ribbon.
You can copy and paste facts from an Excel spreadsheet or .csv file where the first column is
the date and the second column is the fact text. Just select the rows and copy them to your
clipboard, then paste them into TimeMap. When pasting them in Spreadsheet view,
remember to select both cells and not just a single cell.
Related Topics

Using TimeMap 27
© 2017 LexisNexis. All rights reserved.
Creating timelines
Adding fact boxes
Adding text boxes
Creating and saving timelines
Each time you start TimeMap, the Getting Started pane displays. From this pane you can access
a variety of example visuals and can create an unlimited number of timelines.
You can create a new timeline from an existing timeline. Open the timeline you want to
copy. On the File menu, click Save As. Type in a new timeline name and then click Save.
See also Creating templates.
To identify timeline files
Timeline files are identified by the paper and clock icon when saved in folders on your
desktop or network.
To create and save a new timeline
1. On the Getting Started pane, click New Visual.
2. On the New Visual submenu, click New Horizontal or New Vertical.
You can also click New on the Getting Started pane and then select whether you want
the Default Horizontal or Vertical timeline.
The blank timeline template is now ready for you to begin working.
3. Add timeline elements, such as fact and text boxes, to your timeline.
4. On the File menu, click Save As and then click Save As Visual to save your new timeline.
5. In the Save As dialog box, navigate to the folder where you want to save your timeline
files.
6. In the File Name field, type in a name for the new template, then click Save.

TimeMap28
© 2017 LexisNexis. All rights reserved.
To close a timeline
On the File menu, click Close.
Related Topics
Adding fact boxes
Adding text boxes
Creating templates
Deleting timelines
Adding a timeline title
Timelines automatically include titles that are easy to add and edit. This timeline element is
simply a text box centered at the top of the visual.
To add a timeline title
1. Open the timeline you want to use.
2. Double-click on the title bar where it displays "Double-click to add title".
3. In the Text Box Properties dialog box, type in the title you want and click OK.
Using TimeMap 29
© 2017 LexisNexis. All rights reserved.
The new title now displays at the top of your timeline.
Related Topics
Creating timelines
Adding titles and introduction pages
Adding title and introduction pages
Title and introduction pages can be added to timelines to create a polished work product.
When printing charts, TimeMap automatically includes a title page with a border that can be
edited. The title page includes the timeline title, name of the person preparing the timeline, the
organization name, date (optional), timeline details (date of first and last fact, and the total
number of facts). The timeline title, timeline creator, and organization data is automatically
generated if you have already completed the User Information entries (Tools > Options) and
added a timeline title. You can choose whether to include page numbers on the printed output.
An introduction page can also be added to a timeline to add background information regarding
timeline content. Introductions can be one or more pages and can include graphics in the
header or footer so you can insert your organization's logo or other relevant graphics.
To add a title page
1. Click File, click Print, and then click Page Setup.
2. In the Page Setup dialog box, click the Title Page tab.

TimeMap30
© 2017 LexisNexis. All rights reserved.
3. In the Orientation list, click the orientation setting for the title page: Portrait,
Landscape, or Same as Visual.
4. In the Text Alignment list, click the page location for title page text: Top, Top Third,
Middle, Bottom Third, or Bottom.
5. In the Border Style list, click the width for the title page border.
6. In the Border Color list, click the color you want for the title page border.
7. Click the Edit Content button to customize or edit title page text.
Click the Insert Field button and select any fields you want to add to the title page. You
can delete fields too by highlighting the field and the pressing Delete.
Use the format toolbar in the Contents dialog box to customize text or insert a symbol.
8. Click the Edit Graphics button to add a graphic to the header or footer of the title page.
Click the Header Graphic or Footer Graphic tab, depending on where you want the
graphic located.
Click the Load button to navigate to and select the graphic file, then click Open.
In the Position, Size, and Original size areas, adjust the graphic location settings, then
click OK.
See Step 7 for how to format text and insert fields.
9. Click the Preview tab to review the graphic's placement.
10. Click the Options button and select Save as Default to set the title page as a default

Using TimeMap 31
© 2017 LexisNexis. All rights reserved.
template for each timeline.
Click the Load Defaults to clear any selected settings and return to the TimeMap's
default settings for the title page.
11. Click OK to close the Page Setup dialog box.
To add an introduction page
1. Click File, click Print, and then click Page Setup.
2. In the Page Setup dialog box, click the Introduction tab.
3. In the Orientation list, click the orientation setting for the title page: Portrait,
Landscape, or Same as Visual.
4. In the Text Alignment list, click the page location for title page text: Top, Top Third,
Middle, Bottom Third, or Bottom.
5. In the Border Style list, click the width for the title page border.
6. In the Border Color list, click the color you want for the title page border.
7. Click the Edit Content button to customize or edit title page text.
Click the Insert Field button and select any fields you want to add to the title page. You
can delete fields too by highlighting the field and the pressing Delete.
Use the format toolbar in the Contents dialog box to customize text or insert a symbol.
8. Click the Edit Graphics button to add a graphic to the header or footer of the title page.

TimeMap32
© 2017 LexisNexis. All rights reserved.
Click the Header Graphic or Footer Graphic tab, depending on where you want the
graphic located.
Click the Load button to navigate to and select the graphic file, then click Open.
In the Position, Size, and Original size areas, adjust the graphic location settings, then
click OK.
See Step 7 for how to format text and insert fields.
12. Click the Preview tab to review the graphic's placement.
13. Click the Options button and select Save as Default to set the title page as a default
template for each timeline.
Click the Load Defaults to clear any selected settings and return to the TimeMap's
default settings for the introduction page.
14. Click OK to close the Page Setup dialog box.
Related Topics
Creating timelines
Adding a timeline title
Creating templates
Customizing TimeMap options
Using the Fact Design Gallery
The Fact Design Gallery consists of three panes that help you add or customize fact boxes
using a variety of pre-designed styles. The Fact Design Gallery displays to the left of the
timeline window and defaults to the Add New Facts pane, which displays fact box styles
available for the template you currently have open.
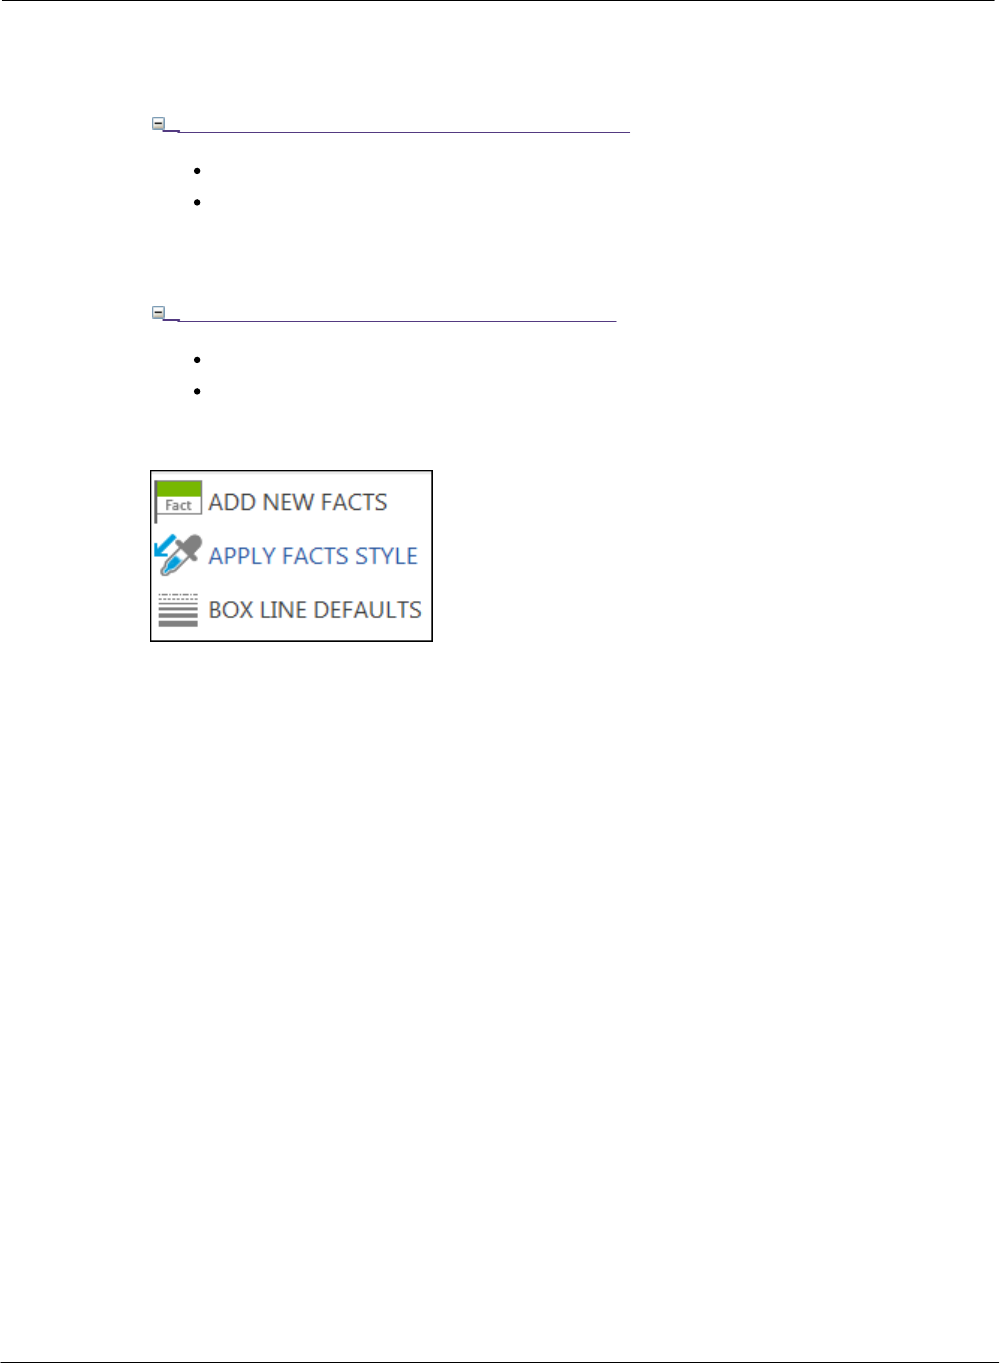
The Fact Design Gallery includes three design tools:
Add New Facts displays fact box styles from the current, open template.
Apply Fact Styles allows you to apply a selected styles to one or more fact boxes in the
timeline.
Box Line Defaults allows you to change the line and flag line styles for new fact boxes.
To add new facts from the gallery
The Add New Facts pane displays fact box styles for the open template. The top fact box
style is the default style. New fact boxes created in either the Timeline or Spreadsheet views
use the default style. Custom styles that are not a default template style display under the

Using TimeMap 33
© 2017 LexisNexis. All rights reserved.
Custom in this Visual heading. If you open a timeline created in an earlier version of
TimeMap, those styles display under the heading. If you edit a fact box in this timeline, the
new style displays here too.
1. In the Add New Facts pane, click on the fact box you want to use.
2. In the New Fact Box, type in the fact date and time, and the fact text.
3. Click OK to add the new fact box to the timeline.
For more information, see Adding fact boxes.
To apply a fact box style
TimeMap34
© 2017 LexisNexis. All rights reserved.
1. Click on the fact box(es) you want to edit.
To select multiple fact boxes in Timeline View
Press the Shift key while clicking on fact boxes.
Or draw a line or a box over fact boxes you want to select.
First click in a blank area of the timeline, then press and hold the left mouse key
while dragging it through the fact boxes you want to select.
To select multiple facts in Spreadsheet View
Press the Shift key while clicking on a consecutive range of facts.
Press the Ctrl key while clicking on facts separated by different spreadsheet rows.
2. In the Fact Design Gallery pane, click the Apply Fact Styles bar.
3. In the Apply Fact Styles list, click the style you want to apply.

Using TimeMap 35
© 2017 LexisNexis. All rights reserved.
4. In the Confirm dialog box, click Yes or No to Apply this style to the selected fact boxes?
The selected fact boxes immediately display with the new style format.
To change box line defaults
Changing the box line styles only affects new fact boxes added to a timeline. If you want to
change an existing fact box, you will need to edit it. The line style is the line extending from
the fact box to the time scale. The flag line style is the end point of the line where it meets
the time scale.
1. In the Fact Design Gallery, click the Box Line Defaults bar.

TimeMap36
© 2017 LexisNexis. All rights reserved.
2. In the Line Style list, click on the line style you want to use.
3. In the Flag Line Style list, click on the flag line style you want to use.
4. Click on the Add New Facts bar.
5. Click on the fact box style you want and type in the date/time and fact text, then click
OK.
The new line styles display for the new fact box.

Using TimeMap 37
© 2017 LexisNexis. All rights reserved.
Related Topics
Creating timelines
Adding fact boxes
Entering dates
About customizing timeline elements
Adding fact boxes
As you add fact boxes to your timeline, TimeMap automatically generates the time scale for
you. The time scale displays at the bottom of your timeline visual.
Each time you add a new fact box, the New Fact dialog box displays for you to type in the date
and fact text. This dialog box is also where you can customize the fact box's font style, color,
and line style. You can also modify the layout of a fact box, and modify image settings or linking
files. See About customizing timeline elements.
Add fact boxes in two views:
Timeline View allows you to see the fact boxes as you add them to the timeline (default
view).
Spreadsheet View allows you to add facts into spreadsheet fields; one fact box per
spreadsheet row.
New facts display with the default style for the template you are using (the top style that
displays in the Add New Facts pane in the Fact Design Gallery). You can apply a new style to a
new fact box or a set of selected fact boxes. You can apply new fact box styles in either view.
See About customizing timeline elements and Using the Fact Design Gallery.
To add a fact box in Timeline view
1. On the Home ribbon, click Fact Box.
Or
2. Click on a fact box in the Add New Facts pane that displays to the left of the timeline.

TimeMap38
© 2017 LexisNexis. All rights reserved.
You can also click the Insert key, or right-click in the timeline and click New Fact Box. See
To add new facts from the gallery.
3. Right-click in the blank space in the Add New Facts pane to Create a New Default Style.
4. Click on the fact box style you want to use.
The New Fact Box dialog box displays.

Using TimeMap 39
© 2017 LexisNexis. All rights reserved.
5. In the Fact tab's Date & Time field, type in the date and time for the fact.
6. In the text box, type in the fact text.
7. On the Fact tab's toolbar, select the font style and size you want to use.
8. Click the Bold, Italicize, or Underscore buttons to use for any selected fact text.
9. Click the Highlight Color button to select a highlight color for any fact text.
10. Click the Font Color button to select the text color.
11. Click the Left, Center, or Right buttons to adjust text alignment within the fact box.
12. Click OK to add the fact box to the timeline.
To add a fact box in Spreadsheet view
1. In the timeline window, click the Spreadsheet View tab and then click Click here to add
a new fact.

TimeMap40
© 2017 LexisNexis. All rights reserved.
2. In the Date & Time field, type in the date and time for the fact.
3. Press Tab.
4. In the Fact Text field, type in the fact text.
5. Press the Insert key to add a new fact and save the previous fact box text.
6. Continue adding facts until you are finished.
7. Press Tab to save the last fact text entry.
8. Click the Timeline View tab to view all your new fact boxes in the timeline.
To delete a fact box
1. Right-click the fact box or fact row and click Delete.
You can click on the fact box and then click the Delete button.
2. In the message to delete the fact, click Yes.
Related Topics
Entering dates
Using the Fact Design Gallery
About customizing timeline elements
Entering dates and times
TimeMap supports a variety of date formats when adding fact boxes to timelines.

Using TimeMap 41
© 2017 LexisNexis. All rights reserved.
TimeMap supports the following date formats:
Complete dates (8/1/00)
Dates and times (8/1/00 5:25 p.m.)
Partial dates and times (8/??/00 5:?? p.m.)
Date and time ranges (8/1/00 5:15 p.m. to 8/1/00 5:19 p.m.)
When you enter a date range, TimeMap's default behavior is to mark both the begin date
and the end date on the time scale.
Entering a date
When entering dates, consider the following:
Type in the known portions of the fact date.
Example: 99 or 3/99 are both valid data entries
Depending on the Date Format setting, TimeMap will automatically provide the day of the
week.
Use mathematical symbols to further define your date entry.
Date status options are:
~ Around
< Before
=< On or Before
= On
=> On or After
> After
TimeMap takes date status into account when you use its Auto-Arrange feature.
Example: A fact box dated <08/02/99 is stacked above one dated 08/02/99.
Entering a time
When entering times, consider the following:
Type in the known portions of the fact date, including the time.
Example: 3/15/00 6:30 p.m.
Set the Date Format setting to either 12-hour or 24-hour (i.e., military time) time
displays.
Enter just the hour and minutes, or add time down to the second.
Substitute question marks for any uncertain portion of the time
Example: 3/15/00 6:?? p.m.
Use mathematical symbols to further define your time knowledge.
Time status options are:
~ Around
< Before
=< At or Before
= At

TimeMap42
© 2017 LexisNexis. All rights reserved.
=> At or After
> After
TimeMap takes time status into account when you use its Auto-Arrange feature.
Example: A fact box with a date of 01/02/00 < 5:15 p.m. is stacked above one dated
01/02/00 > 5:15 p.m.
Type in alternate date text for individual fact boxes. See Customizing date display.
Entering date/time ranges
When entering a date/tim e range, consider the following:
Enter just a date range.
Example: 3/15/00 to 4/12/00
Enter a range of both date and time
Example: 3/15/00 5:15 a.m. to 3/16/00 2:14 p.m.
You must enter the date twice even if the times are on the same day.
Use either "to" or "-" to separate the beginning date from the ending date.
By default TimeMap marks both the beginning and ending date.
If you want to display a date range in your fact box and have TimeMap only mark the
beginning date, clear the Draw Date Range check box in the Fact Box Properties dialog
box.
Changing the date format and style
1. On the Box Tools Format ribbon, click Fact Date, and then click Style to open the
Format Fact Date Style dialog box.
2. In the Date & Time Format area, select the following format settings: Date, Date
Delimiter, Time, and Time Delimiter.
Using TimeMap 43
© 2017 LexisNexis. All rights reserved.
3. In the Display Options area, select the options you want to use: Year, Month, Day,
Century, Day of Week, Hours, Minutes, Seconds.
4. Click OK to save your settings.
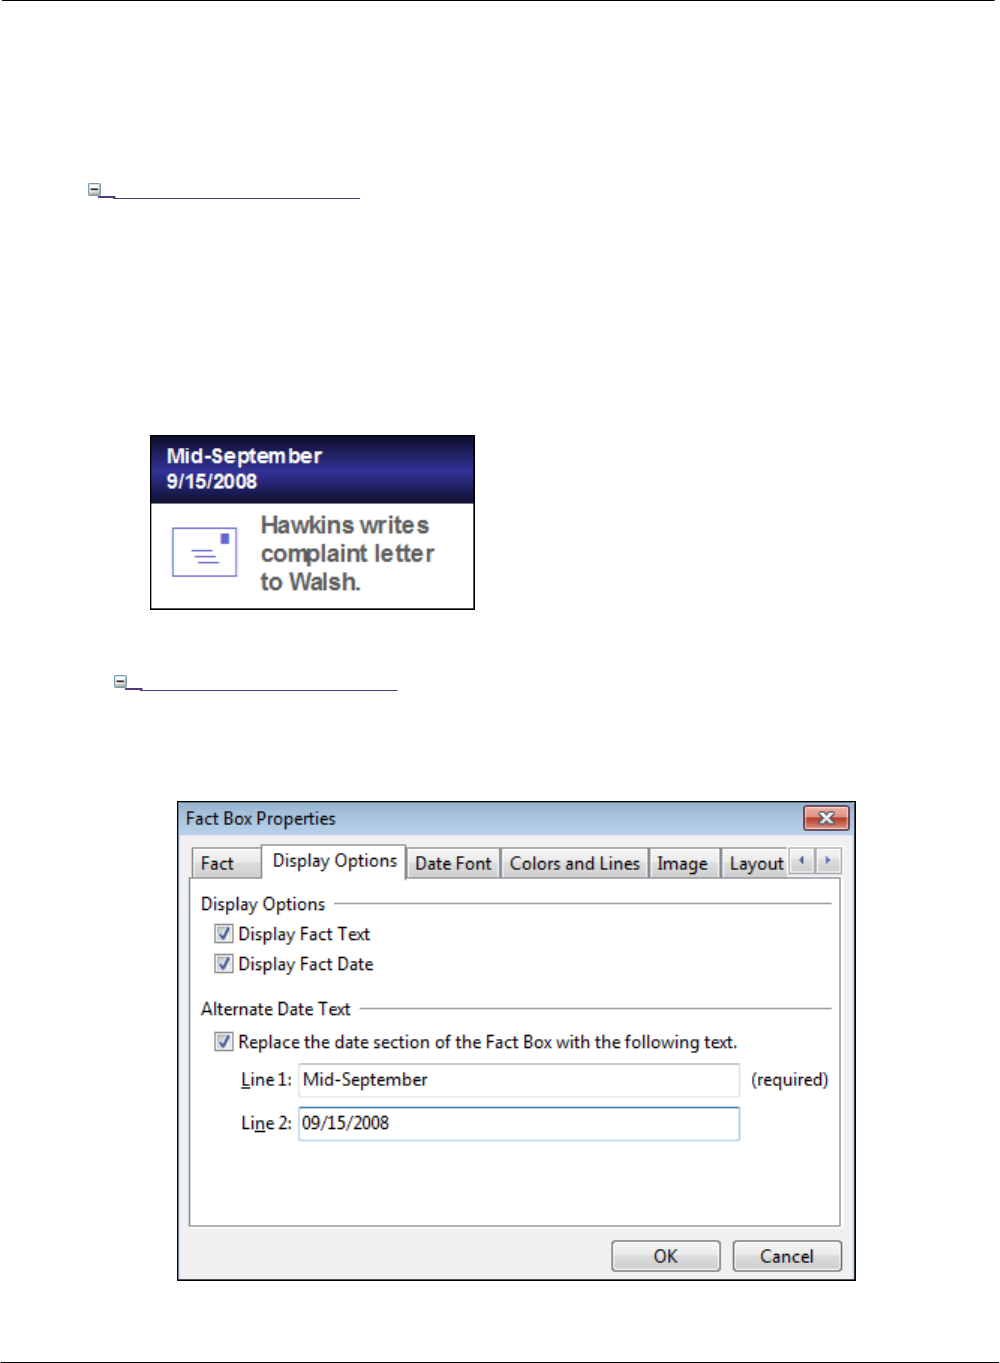
Customizing date display
Once your date format and display settings are selected, you can still make additional text
customizations in a fact box. For example, you might have your date format set to the
original date below and want to edit the date display to the modified date below as well as
a line drop to the date scale for September 15, 2008.
Original date: September 15, 2008
Modified date: Mid-September 2008
To add alternate date text
1. Double-click on a fact box in the timeline.
2. In the Fact Box Properties dialog box, click the Display Options tab.

TimeMap44
© 2017 LexisNexis. All rights reserved.
3. In the Alternative Date Text area, select the Replace the date section of the Fact
Box with the following text check box.
4. In the Line 1 field, type in the date you want to display on the top row: Mid-
September.
5. In the Line 2 field, type in the date you want to display on the second row:
9/15/2008.
6. Click OK to save the changes.
The alternative date text now displays in the fact box.
Related Topics
Creating timelines
Adding fact boxes
Using the Fact Design Gallery
Changing date fonts in fact boxes
Changing date alignment in fact boxes
Adding text boxes
In addition to fact boxes or pictures, text boxes are another element you can add to your
timeline. Text boxes can be added to the timeline any where you want to include additional
information, emphasize key points, or add a timeline key.
Text boxes differ from fact boxes because they do not contain dates and do not connect to or
affect the timescale. They also do not have border or fill by default, but you can add these style
changes if you want. The title of a new timeline is a text box that can be edited to include the
text and styles you want for this element.
To move a text box, click on it and drag it to the new location.
To add a text box
1. On the Home ribbon, click Text Box.

Using TimeMap 45
© 2017 LexisNexis. All rights reserved.
2. In the timeline, click in the area where you want the text box positioned.
3. In the New Text Box dialog box, type in the text you want.
4. On the Text tab's toolbar, select the font style and size you want to use.
5. Click the Bold, Italicize, or Underscore buttons to use for any selected text.
6. Click the Highlight Color button to select a highlight color for any text.
7. Click the Font Color button to select the text color.
8. Click the Left, Center, or Right buttons to adjust text alignment within the text box.
9. Format the text as you want it to display using the Colors and Lines, Image, Layout
and Linked Files tabs.
10. Click OK.
Related Topics
Creating timelines
Adding fact boxes
Adding pictures and clip art
About customizing timeline elements
Changing text fonts and styles

TimeMap46
© 2017 LexisNexis. All rights reserved.
Adding pictures and clip art
Pictures and/or clip art can be added to the timeline anywhere you want, including fact and text
boxes. You must be in Timeline View to add a picture or image to the timeline. The supported
image file types include: .jpg, .gif, .bmp., .emf (enhanced metafile), and .wmf (Windows
metafile). You can edit picture display and layout properties, and attach linked files to them too.
Pictures added to the timeline outside of a fact or text box, do not contain dates, do not
connect to the time scale, and do not move when the time scale repositions itself.
Earlier editions of Microsoft Office will still have clip art stored in the program. Newer
versions use images cleared through the Creative Commons licensing system and are
accessible via the Bing search engine. For more information, contact Microsoft support.
When adding a picture, you can choose from the following tabs:
Gallery includes a variety of images from TimeMap's program files.
Icon includes a selection of font-based icons.
In Use displays images already used in this timeline.
File allows you to add an image file saved on your desktop or in a network folder.
Clipboard displays the last image copied from the Microsoft Clip Organizer.
To add a picture anywhere in the timeline
1. On the Home ribbon, click Images, and then click Picture.
You can also right-click on the timeline and click New Picture > Choose Picture.
2. In the Choose Picture dialog box, click on the tab for the type of image you want to
add: Gallery, Icon, In Use, File, Clipboard.

Using TimeMap 47
© 2017 LexisNexis. All rights reserved.
3. Click on the image you want or browse to locate a file, then click OK.
To add a picture to a fact or text box
1. Double-click on the fact box you want to edit.
2. In the Fact Box Properties dialog box, click the Image tab.
3. Click the Pick Image button.

TimeMap48
© 2017 LexisNexis. All rights reserved.
4. In the Choose Picture dialog box, click on the tab for the type of image you want to
add: Gallery, Icon, In Use, File, Clipboard.
5. Click on the image you want or browse to locate a file, then click OK.
6. Preview the selected image in the Image tab.
7. In the Size and Scale area, click in the Height and Weight lists to increase or reduce the
image size.
8. Select or clear the Lock Aspect Ratio check box.
9. In the Image area, select or clear the Transparent check box.
The Transparent check box may be grayed out if it does not apply to the selected image.
10. In the Pad list, click on the arrows to add white space before and after the image and
text.
11. Click the Change Image or Remove Image buttons to edit or delete images.
12. Click OK to insert the image into the fact box.
To add Microsoft clip art
The first time you add Microsoft Clip organizer images to your timeline, you have the option
to organize folders for your projects. The following procedures include these steps.
If you want to insert clip art anywhere in the timeline, you should resize the image in an
image editor before copying it into the timeline.
1. Click on the fact or text box or region of the timeline where you want to add the clip art.

Using TimeMap 49
© 2017 LexisNexis. All rights reserved.
2. On the Home ribbon, click Images, and then click Clip Art.
You can also right-click on the timeline and click New Picture > Clip Art.
3. In the Microsoft Clip Organizer dialog box, browse to locate the image you want to
add.
4. To create a My Favorites folder to organize images
1. Click on the arrow next to the image and click Copy to Collection (Office Collections)
or Make Available Offline (Web Collections).
2. In the Copy to Collection dialog box, click on the folder where you want to save the
image, then click OK.
3. Click the New button to organize images under the My Collections folder.

TimeMap50
© 2017 LexisNexis. All rights reserved.
4.In the New Collection dialog box, type in the name of the folder and click OK.
5.Click on the folder or subfolder you want where you want to add the new folder, then
click OK.
6.Click OK.
6. In the Microsoft Clip Organizer dialog box, click on the folder where the image you want
is saved or select a new image to use.
7. Right-click on the image and click Copy.
8. Click on your timeline and click Paste.
9. If you want to use the image anywhere in your timeline, you can move it to the region
where you want it to display.
10. Double-click on the box you want to insert the image into and click the Image tab.
11. Click the Pick Image button.
12. In the Choose Picture dialog box, click the Clipboard tab.
13. Click OK.
14. Click OK to insert the image into the fact or text box.
15. To resize the image, double-click on the box.

Using TimeMap 51
© 2017 LexisNexis. All rights reserved.
1. In the Fact or Text Box Properties dialog box, click the Image tab.
2. In the Size and Scale area, click the arrows to adjust the Height and Width.
3. Select or clear the Lock Aspect Ratio check box.
4. In the Pad list, click on the arrows to add white space before and after the image
and text.
Related Topics
Creating timelines
Adding fact boxes
Adding text boxes
About customizing timeline elements
Adding linked files
With TimeMap, you are able to link chart elements to images and to other external files. For
example, you can link a fact box to a PDF file containing the image of a document being
referenced by the flag. As you view the timeline, a linked file can be opened by pointing to the
element and clicking on the paperclip icon that displays above it. In addition to linking directly to
files, TimeMap can call viewer applications such as Summation and Concordance Image and
have them display images.
Many files that you link to timeline elements will use TimeMap's default Windows File
viewer. If the Windows File viewer does not work, you will need to set up a custom file
viewer. See About file viewers.
To add a linked file to a timeline element
1. Double-click on a timeline element, such as a Fact or Text box, to open the Properties
dialog box.

TimeMap52
© 2017 LexisNexis. All rights reserved.
2. Click on the Linked Files tab.
3. Click on the Add button to open the Linked Files Properties dialog box.
4. In the File Viewer list, click on the appropriate file viewer.
5. Click the Browse button to locate the external file you want to link to the element.
6. Click OK to fill in the Linked File field.
7. Click OK to return to the Linked Files tab of the Properties dialog box.
8. Continue to add additional Linked files as needed.
9. Click OK when you are finished.
To open a linked file in a timeline element
1. Place your mouse pointer over the timeline element with a linked file attachment.

Using TimeMap 53
© 2017 LexisNexis. All rights reserved.
The mouse pointer will change its shape to a four-headed arrow and a paperclip icon will
display at the top of the element to indicate a linked file attachment.
2. Click on the paperclip icon to open the linked file.
You can also click on the drop-down arrow that displays when you first place your mouse
pointer over the paperclip icon.
A list of linked files linked to the timeline element displays.
3. Click on the file you wish to view.
Related Topics
Adding fact boxes
About file viewers
Changing linked files
Adding/changing file viewers
Setting up custom file viewers
Creating templates
TimeMap's template feature allows you to quickly create a polished timeline. A template is a
pre-defined chart style that includes default fact flags in several color choices, a background
style, a title text box style, a set timescale orientation, timescale styles, and other timeline
elements.
You can select from a gallery of pre-built TimeMap templates or you can save your own
timelines as templates. You can also set a template as a default template for new timelines.
You can only create new timelines from templates. You cannot open templates to edit them.
When you save a timeline as a template, the templates are saved in categories by the time

TimeMap54
© 2017 LexisNexis. All rights reserved.
scale orientation and color combination. Templates are saved with a .tmvt file extension. You
can access this template in the Getting Started pane or in the My Templates Folder in the
Templates dialog box.
To create a timeline using a template
1. On the Getting Started pane, click New Visual.
2. On the New Visual submenu, click New from template.
The Templates dialog box displays.
3. In the Time Scale Orientation area, select the preferred location for the time scale:
Show All, Horizontal, or Vertical.
4. In the Select a Template list, click the template you want to use.
Each template you select displays in the Preview box.
Double-click Browse for Templates to locate a template saved in a desktop or network
folder.
5. Select the Show only Black & White Templates check box if you want to view only
those templates.

Using TimeMap 55
© 2017 LexisNexis. All rights reserved.
6. Click the Default button to select default options:
Set as Default Horizontal Template
Set as Default Vertical Template
Set as Default Send from CaseMap Template
7. In the message to set the default template, click Yes.
8. Click OK.
To save a timeline as a template
1. Open the timeline you want to use for a template.
2. Click File, click Save As and then click Save As Template.
3. In the Save Visual as a Template dialog box, navigate to the folder where you want to
save template files.
4. In the File Name field, type in a name for the new template, then click Save.
5. In the Template Color Category dialog box, select the color category: Black & White,
Shades of Gray or Colors.
6. Click OK.
7. In the message to save the timeline, click OK.
You can access this template later in the Getting Started pane under the New from
Template panel. See To open a custom template.
To open a custom template
You can open a custom template from the Getting Started pane.
1. On Getting Started Pane, click New Visual, and then click New from template.
3. In the Templates dialog box, click the My Templates folder in the Select a Template list.
4. Click the custom template you want to open.
5. Click OK to create a new timeline from this template.
Related Topics
Creating timelines
Deleting timelines

TimeMap56
© 2017 LexisNexis. All rights reserved.
Selecting timeline elements
Before timeline elements (fact boxes, text boxes and pictures) can be edited, they must be
selected. When you select an element, eight small selection indicators appear around the
perimeter of the element to confirm your choice.
Selecting multiple elements can make it easier to edit your timeline. When you do, the changes
you make affect all the elements you have selected. Suppose you want to change the font style
and size used for all of your fact boxes. You do not have to select each individual box to make
the same changes. Instead press CTRL+A, which selects all fact boxes, and make the changes
once by double-clicking on a selected fact box to open a properties dialog box.
To select timeline elements in Timeline view
Timeline view elements include fact and text boxes, and pictures.
Selecting one elements — Click on the element you want to edit.
Selecting multiple elements — Press and hold the Shift key while clicking on the
elements you want to edit.
You can also click in a blank area of the timeline, then press and hold the left mouse key
while dragging it through the fact boxes you want to select.
Selecting all Fact boxes — Press Ctrl + A or right click in a blank area of the timeline,
and click Select All Facts on the submenu.
Select all Fact and Text boxes, and pictures — On the Home Ribbon, click Find & Select,
click Select on the submenu, and then click All. You can also press Shift + Ctrl + A.
To select fact records in Spreadsheet view
Spreadsheet vie elements include rows of fact records.
Selecting one row — Click on the row.
Selecting multiple fact records — Choose one of the following:
Press the Shift key while clicking on a consecutive range of facts.
Press the Ctrl key while clicking on facts separated by different spreadsheet rows.
Selecting all Fact boxes — Click on the first row, then scroll to the last record you want
to select. Press Shift and click the last row of the set.
Related Topics
Copying timeline elements
Resizing timeline elements
Deleting timeline elements

Using TimeMap 57
© 2017 LexisNexis. All rights reserved.
Resizing timeline elements
When you enter text into a fact or text box, or when you insert a picture into your timeline,
TimeMap automatically creates a box that fits the text or picture you have added. If you want,
you can adjust the size of these elements. You can do so manually or you can use TimeMap
options that make it easy to give elements a consistent width or height.
To manually resize an element
1. Locate the timeline element you want to resize.
2. Click on the squares on the side or bottom of the selected element.
Your mouse pointer will change shape to a double-headed arrow.
3. Click and drag the element to the desired width and height.
To change the TimeMap size settings
1. Select the timeline elements you want to resize.
Press Ctrl + A to select all fact boxes.
2. On the Box Tools Format ribbon, click Size.
Related Topics
Selecting timeline elements
Copying timeline elements
Deleting timeline elements
Copying timeline elements
You can save time by copying elements from one timeline into another. This feature is helpful if
you create a master timeline with all the facts and want to create a series of separate charts
focusing on a specific time period. When you copy an element, most of its properties (color and
line style) are copied along with the date and text information.
To copy elements to a new timeline
1. Click on the element you want to copy.
2. On the Home ribbon, click Copy, and then click Copy to New Visual.
The element is automatically copied to a new, blank timeline.

TimeMap58
© 2017 LexisNexis. All rights reserved.
To copy elements into another timeline
1. Right-click on the element you want and click Copy.
You can also click Copy on the Home ribbon.
2. In the second timeline, right-click and click Paste.
You can also click Paste on the Home ribbon.
Related Topics
Adding fact boxes
Adding text boxes
Adding pictures and clip art
Selecting timeline elements
Resizing timeline elements
Deleting timeline elements
Deleting timeline elements
Deleting timeline elements is nearly identical in both Timeline and Spreadsheet views. Once a
fact box is deleted, TimeMap automatically rescales the timeline. Deleting text boxes and
pictures or clip art does not affect the time scale.
To delete boxes in Timeline view
1. Click on the element(s) you want to delete: fact box, text box, picture, etc.
To select multiple elements, press the Shift key while click on the elements.
You can also left-click and drag a line through the elements you want to delete.
2. Click the Delete button.
You can also right-click and click Delete, click Delete on the Box Tools Format ribbon, or
press the Delete key.
3. In the message to delete the box, click Yes.
To delete boxes in Spreadsheet view
1. Click on the fact(s) you want to delete.
Press the Shift key while clicking on a consecutive range of facts.
Press the Ctrl key while clicking on various fact rows.

Using TimeMap 59
© 2017 LexisNexis. All rights reserved.
Click and drag on the numbers to the left of fact rows.
2. Click the Delete button.
You can also right-click and click Delete, click Delete on the Spreadsheet Tools ribbon, or
press the Delete key.
3. In the message to delete the box, click Yes.
To delete pictures or clip art
1. Double-click on the picture or clip art.
2. Click the Image tab.
3. Click the Remove Image button and then click OK.
To remove images added to other parts of the timeline, click on the image and click the
Delete button.
Related Topics
Adding fact boxes
Adding text boxes
Adding pictures and clip art
Selecting timeline elements
Deleting timelines
If you need to delete a timeline, you may want to store a copy in an archive folder. Once you
delete a timeline file, you cannot retrieve it.
To delete a timeline
1. On the Getting Started pane, click Open.
You can also click Open Visual.
2. Click on Computer and navigate to the folder location where the timeline you want to
delete is saved.
3. Right-click on the file and click Delete.
4. In the Delete File box, click Yes.
5. Click Cancel to return to TimeMap.

TimeMap60
© 2017 LexisNexis. All rights reserved.
6. In the Getting Started pane, right-click on the timeline link in the Open Visual panel and
click Remove from list.
Related Topics
Creating timelines
Creating templates
Importing Data
Send facts from CaseMap
LexisNexis CaseMap is a case organization and analysis tool that will help you track and build
case strategy. CaseMap helps you organize critical information about facts, documents, and
issues in cases by providing the tools you need to analyze facts and issues. CaseMap also
helps you quickly create case reports for case staff, your client, and the court.
In CaseMap, you can filter your relevant case facts and seamlessly import them from the Facts
spreadsheet into your TimeMap timeline using the Send to TimeMap tool.
To download a 30-day free trial copy of CaseMap, visit our website at www.lexisnexis.com/
casemap/casemap.
To send data from CaseMap
1. In TimeMap, open the timeline for which you want to import facts.
2. In CaseMap, click on the Facts spreadsheet.
3. On the File menu, click Send to and then click LexisNexis TimeMap.
4. On the submenu, click Current Record or Spreadsheet.
5. The fact record(s) now displays in a fact box(es) in your timeline.
Related Topics
Creating timelines
Importing data into timelines
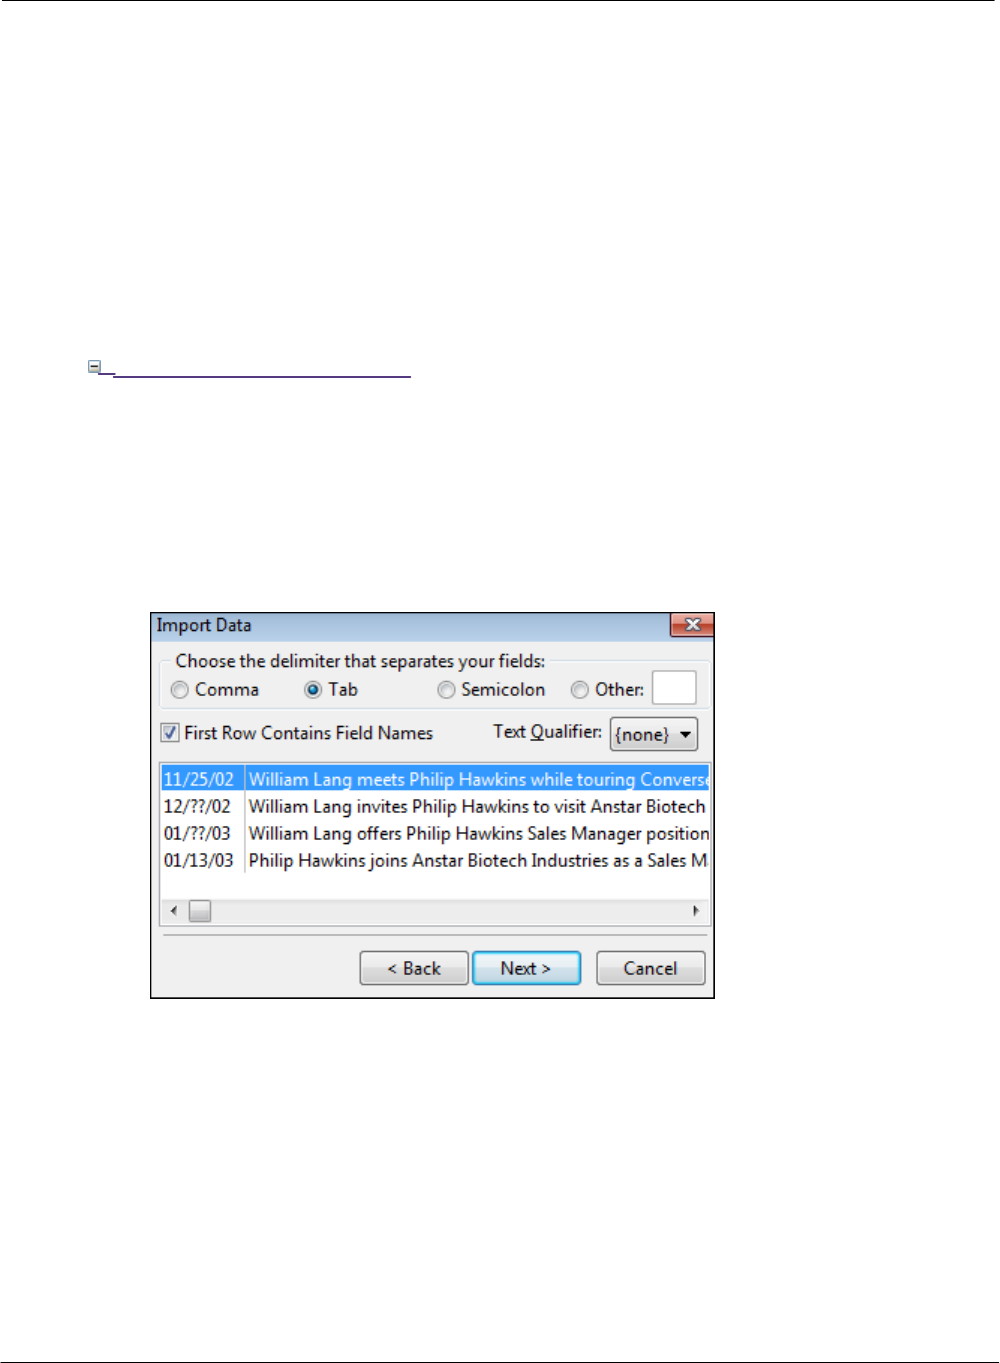
Using TimeMap 61
© 2017 LexisNexis. All rights reserved.
Importing text into timelines
Use TimeMap's text import utility to import fact box information from other applications. The
best way to do this is to import a delimited text file that includes the dates and fact text you
want to import into TimeMap to create a timeline.
You can import information from a word-processing file, but these files typically need a lot of
clean-up work before they are ready to be imported.
Once the import is complete, your timeline will be populated with fact boxes containing the date
and information from the text file.
To import data from a text file
1. Save a text file from an application.
2. On the File menu, click Import.
3. In the Select File to Import dialog box, click the file to import and then click Open.
4. In the TimeMap Import Wizard, click Next.
5. In the Import Data dialog box, select the delimited you want to use.
Select the First Row Contains Field Names check box if you have field names in your text
file, then click Next.
6. In the Preview the data to import dialog box, verify the data, then click Next.

TimeMap62
© 2017 LexisNexis. All rights reserved.
Click the Next 5 button to page through data in your text file. Click the Top button to
return to the beginning of the text file data.
7. In the Select the import field dialog box, click on the field where you want to import the
date and time, then click Next.
Select the Do not Import a "Date & Time" check box if you want to manually enter each
fact date.
8. In the next dialog box, select the field where you want to import fact text, then click
Next.

Using TimeMap 63
© 2017 LexisNexis. All rights reserved.
9. In the review dialog box, click Finish.
10. In the message confirming the number of facts imported, click OK.
11. In the Insert Multiple Facts dialog box, modify and review content as needed.
In this instance, you would need to modify data in the Date & Time field to the proper
date format of MM/DD/YYYY.
Click on the Insert or Delete buttons to add or remove fact data.
Click the Sort button to change the sort order.
Click the Grid Font button to select the font type, style, size, and color you want to user.
12. Click OK to continue.

TimeMap64
© 2017 LexisNexis. All rights reserved.
Fact boxes with the date and information from the text file now display in chronological
order in your timeline.
Related Topics
Creating timelines
Send facts from CaseMap
Customizing Timelines
Using the Fact Design Gallery
The Fact Design Gallery consists of three panes that help you add or customize fact boxes
using a variety of pre-designed styles. The Fact Design Gallery displays to the left of the
timeline window and defaults to the Add New Facts pane, which displays fact box styles
available for the template you currently have open.
The Fact Design Gallery includes three design tools:
Add New Facts displays fact box styles from the current, open template.
Apply Fact Styles allows you to apply a selected styles to one or more fact boxes in the
timeline.
Box Line Defaults allows you to change the line and flag line styles for new fact boxes.
To add new facts from the gallery
The Add New Facts pane displays fact box styles for the open template. The top fact box
style is the default style. New fact boxes created in either the Timeline or Spreadsheet views
use the default style. Custom styles that are not a default template style display under the
Custom in this Visual heading. If you open a timeline created in an earlier version of
TimeMap, those styles display under the heading. If you edit a fact box in this timeline, the
new style displays here too.
1. In the Add New Facts pane, click on the fact box you want to use.

Using TimeMap 65
© 2017 LexisNexis. All rights reserved.
2. In the New Fact Box, type in the fact date and time, and the fact text.
3. Click OK to add the new fact box to the timeline.
For more information, see Adding fact boxes.
To apply a fact box style
1. Click on the fact box(es) you want to edit.
To select multiple fact boxes in Timeline View

TimeMap66
© 2017 LexisNexis. All rights reserved.
Press the Shift key while clicking on fact boxes.
Or draw a line or a box over fact boxes you want to select.
First click in a blank area of the timeline, then press and hold the left mouse key
while dragging it through the fact boxes you want to select.
To select multiple facts in Spreadsheet View
Press the Shift key while clicking on a consecutive range of facts.
Press the Ctrl key while clicking on facts separated by different spreadsheet rows.
2. In the Fact Design Gallery pane, click the Apply Fact Styles bar.
3. In the Apply Fact Styles list, click the style you want to apply.

Using TimeMap 67
© 2017 LexisNexis. All rights reserved.
4. In the Confirm dialog box, click Yes or No to Apply this style to the selected fact boxes?
The selected fact boxes immediately display with the new style format.
To change box line defaults
Changing the box line styles only affects new fact boxes added to a timeline. If you want to
change an existing fact box, you will need to edit it. The line style is the line extending from
the fact box to the time scale. The flag line style is the end point of the line where it meets
the time scale.
1. In the Fact Design Gallery, click the Box Line Defaults bar.

TimeMap68
© 2017 LexisNexis. All rights reserved.
2. In the Line Style list, click on the line style you want to use.
3. In the Flag Line Style list, click on the flag line style you want to use.
4. Click on the Add New Facts bar.
5. Click on the fact box style you want and type in the date/time and fact text, then click
OK.
The new line styles display for the new fact box.

Using TimeMap 69
© 2017 LexisNexis. All rights reserved.
Related Topics
Creating timelines
Adding fact boxes
Entering dates
About customizing timeline elements
Changing fact box direction
Fact boxes can face both right and left of the vertical line or flag line that connects them to the
time scale. Fact boxes can also be dragged off the vertical axis to the left or right, creating a
horizontal line toward the box. These options make it easy to position a cluster of facts
occurring in a compressed time period.
To change fact box direction
1. Select one or more Fact boxes.
To select multiple Fact boxes, press the Shift key while clicking on the boxes you want to
reposition.
2. On the Box Tools Format menu, click Flag Orientation.
You can also right-click on the Fact box and click Left Side of the Line or Right Side of the
Line.
3. On the submenu, click Left Side of Line or Right Side of Line.
The Fact box now displays in the location selected.
You can also drag the fact box to the location you want. When you do so, you may also

TimeMap70
© 2017 LexisNexis. All rights reserved.
increase the flag line by creating a vertical and/or horizontal line in the direction you
move the box.
Related Topics
Using the Fact Design Gallery
About customizing timeline elements
Changing date fonts in fact boxes
Customizing timeline elements
About customizing timeline elements
You can customize or edit fact and text box properties in a variety of ways. You can customize
or edit individual boxes or select multiple boxes. When selecting multiple boxes, you are limited
to the types of property changes you can make. All box properties are accessible when an
individual box is selected.
You can also create a custom fact box in the Fact Design Gallery. See Using the Fact Design
Gallery.
Review fact box properties
Individual fact box properties you can customize or edit include:
Fact text fonts and styles
Date display options and date text
Date fonts
Colors and lines for box fill, borders, and flag lines
Image size and transparency
Text anchor points and margins
Linked files
If you select multiple fact boxes, you can only apply changes to colors and lines, images, and
text layout.
Review text box properties
Individual text box properties you can custom ize or edit include:
Text fonts and styles
Color and lines for box fill and borders

Using TimeMap 71
© 2017 LexisNexis. All rights reserved.
Image size and transparency
Text anchor points and margins
Linked files
If you select multiple text boxes at one time, you can only change properties for colors and
lines, images, and text layout.
Review picture or clip art properties
Individual picture or clip art properties you can customize or edit include:
Image size and transparency
Color and lines for box fill and borders
Anchor points and margins
Linked files
If you select multiple pictures or clip art images at one time, you can only change properties
for pictures, colors and lines, images, and layout.
Related Topics
Changing text fonts and styles
Changing display options in fact boxes
Customizing the date with text
Changing the fill color
Changing the border color and style
Changing layout settings
Changing linked files
Changing text fonts and styles
You can change the text font and style that displays in your fact and text boxes. The font style
of dates is set independently from the font used to display text. The default font for text and
dates is Arial, size 11 point.
To change the text font and style
1. Select the fact or text box(es) with fonts that you want to edit.
2. On the Box Tools Format ribbon, click the Font dialog box launcher .
You can also double-click the selected boxes to open the Fact Box Properties dialog box,
then click the Fact or Text tab to use the formatting toolbar.

TimeMap72
© 2017 LexisNexis. All rights reserved.
1. In the Font list, select the font you want to use.
2. In the Font Style list, select the style you want: Regular, Italic, Bold, Bold Italic.
3. In the Size box, click the font size.
4. In the Underline list, select an underline style.
5. In the Color list, select the font color.
6. In the Effects area, select check boxes for the following: Strikethrough, Superscript, or
Subscript.
7. In the Alignment area, select the font alignment: Left, Center, Right or Justify.
8. Click OK to save your changes.
Related Topics
About customizing timeline elements
Changing date fonts in fact boxes
Changing display options in fact boxes
Changing date fonts in fact boxes
You can change the date font and font styles that displays in the date portion of your fact
boxes. Once you change the date's font and style all subsequent fact boxes added to the
timeline will include these settings. The date's font style is set independently from the font
used to display text and styles used to determine date format. The default font for dates is
Arial, size 11 point.
To change the date font and style
1. Select the fact boxes for which you want to edit the date font.
2. On the Box Tools Format menu, click the Fact Date button and click Font.

Using TimeMap 73
© 2017 LexisNexis. All rights reserved.
You can also double-click on selected boxes to open the Fact Box Properties dialog box,
then click the Date Font tab to use the formatting toolbar.
3. In the Font list, select the font you want to use.
4. In the Font Style list, select the style you want: Regular, Italic, Bold, Bold Italic.
5. In the Size box, click the font size.
6. In the Underline list, select an underline style.
7. In the Color list, select the font color.
8. In the Effects area, select check boxes for the following: Strikethrough, Superscript, or
Subscript.
9. In the Alignment area, select the font alignment: Left, Center, or Right.
10. Click OK to save your changes.
To format the fact date style
1. Select the fact boxes for which you want to edit the date style.
2. On the Box Tools Format menu, click the Fact Date button and click Style.
3. In the Date list, select a format for the date style.
4. In the Delimiter list, select a delimiter for the date format: Slash, Hyphen or Period.

TimeMap74
© 2017 LexisNexis. All rights reserved.
5. In the Time list, select a format for the time style: 12 Hour or 24 Hour.
6. In the Delimiter list, select a delimiter for the time format: Colon or Period.
Related Topics
About customizing fact and text boxes
Changing text fonts/styles in fact and text boxes
Changing display options in fact boxes
Changing display options in fact boxes
You can choose whether to display text or dates in fact boxes. If there is a need to hide text or
a date in a particular box, it is simple to do so.
To change the date display options
1. Select the fact boxes you want to edit.
2. Double-click one of the selected elements to display the Properties dialog box.
3. Click the Display Options tab.
4. In the Display Options area, select or clear Display Fact Text and Display Fact Date
check boxes to toggle them on or off.

Using TimeMap 75
© 2017 LexisNexis. All rights reserved.
5. Click OK to save your changes.
Related Topics
About customizing timeline elements
Changing text fonts and styles
Changing date fonts in fact boxes
Changing date alignment in fact boxes
The date alignment can easily be adjusted in one or multiple fact boxes at one time.
To change the fact date alignment
1. Select the fact boxes for which you want to adjust date alignment.
2. On the Box Tools Format ribbon, click the Fact Date button and select the font
alignment: Left, Center, or Right.
You can also double-click the selected boxes to open the Fact Box Properties dialog box,
then click the Date Font tab to select the alignment.
Related Topics
About customizing timeline elements
Changing date fonts in fact boxes
Changing display options in fact boxes
Customizing the date with text
Customizing the date with text
You can replace a specific date or date range on a fact box with customized text of your choice.
For example, you might have a fact with the date of September 15, 2008. You can substitute
"Mid-September 2008" in the date portion of the Fact box and still have a line drop to the time
scale on 9/15/08.
For more information on date and time settings, see Entering dates and times.

TimeMap76
© 2017 LexisNexis. All rights reserved.
To add a custom date setting
1. Double-click the fact box for which you want to edit the date text.
The Fact Box Properties dialog box displays.
2. Click the Display Options tab, and in the Alternate Date Text area, select the Replace
the date section of the Fact Box with the following text check box.
3. In the Line 1 field, type the text you want to display.
4. In the Line 2 field, type any additional text you want to display in the date portion of the
fact box.
5. Click OK to save your changes.
Related Topics
Entering dates and times
Changing date fonts in fact boxes
Changing display options in fact boxes
Changing date alignment in fact boxes
Changing the fill color
You can change whether TimeMap displays a color or gray scale fill in the fact and date portions
of fact boxes and in the background of text boxes or pictures. Use options on the Colors and

Using TimeMap 77
© 2017 LexisNexis. All rights reserved.
Lines tab of the Properties dialog box to make your selections.
To change the fill color
1. Select the fact and text boxes you want to edit.
2. Double-click one of the selected elements to display the Fact/Text Box Properties dialog
box.
You can also right-click, and then click Properties.
3. Click the Colors and Lines tab.
4. In the Fill area, click on the Box list to select the fill color.
5. In the Date list, click the background color you want for the date section of a fact box.
6. Click OK to save your changes.
Related Topics
About customizing timeline elements
Changing the border color and style

TimeMap78
© 2017 LexisNexis. All rights reserved.
Changing the border color and style
TimeMap makes it easy to edit the color and style of the borders around chart elements (fact
boxes, text boxes and pictures). You can choose different line styles, colors, or border options.
You can set your elements so they have square or rounded corners. By default, text boxes and
pictures have no line setting. However, a border can be added using options in the Properties
dialog box.
For fact boxes, you are also given the ability to decide whether or not to display the fact flag
Line. This is the line connecting the fact box to the time scale. If you decide to display this line,
there are many different style choices available to you.
To change the border color and style
1. Select the elements for which you want to edit the line color and style.
2. Double-click the selected elements to open the Properties dialog box..
You can also right-click, and then click Properties.
3. Click the Colors and Lines tab.
4. In the Border Line area, click on the Color list to select the border line color.
5. In the Borders list, select the border line segment option you want.
6. In the Style list, select the border outline style you want.
7. In the Corner list, select Rounded or Squared.
8. Click OK.

Using TimeMap 79
© 2017 LexisNexis. All rights reserved.
Related Topics
About customizing timeline elements
Changing the fill color
Changing layout settings
You can change the layout design of fact and text boxes in your timeline. You can choose
whether to display the date portion of a fact box or whether to display text. You can also add
images (pictures, drawings, icons) to the text area of both fact and text boxes. For fact boxes,
you can also choose to display only an image and no text.
To change the layout settings
1. Select the timeline elements you want to edit.
2. Double-click the selected elements to display the Properties dialog box.
You can also right-click, and then click Properties.
3. Click the Layout tab.
4. In the Anchor Point area, click the Text list to select the text alignment: Top of Box,
Middle of Box, or Bottom of Box.
The Text list only displays for fact and text boxes.
5. In the Internal Margin area, adjust the text margins: Left, Right, Top, and Bottom.
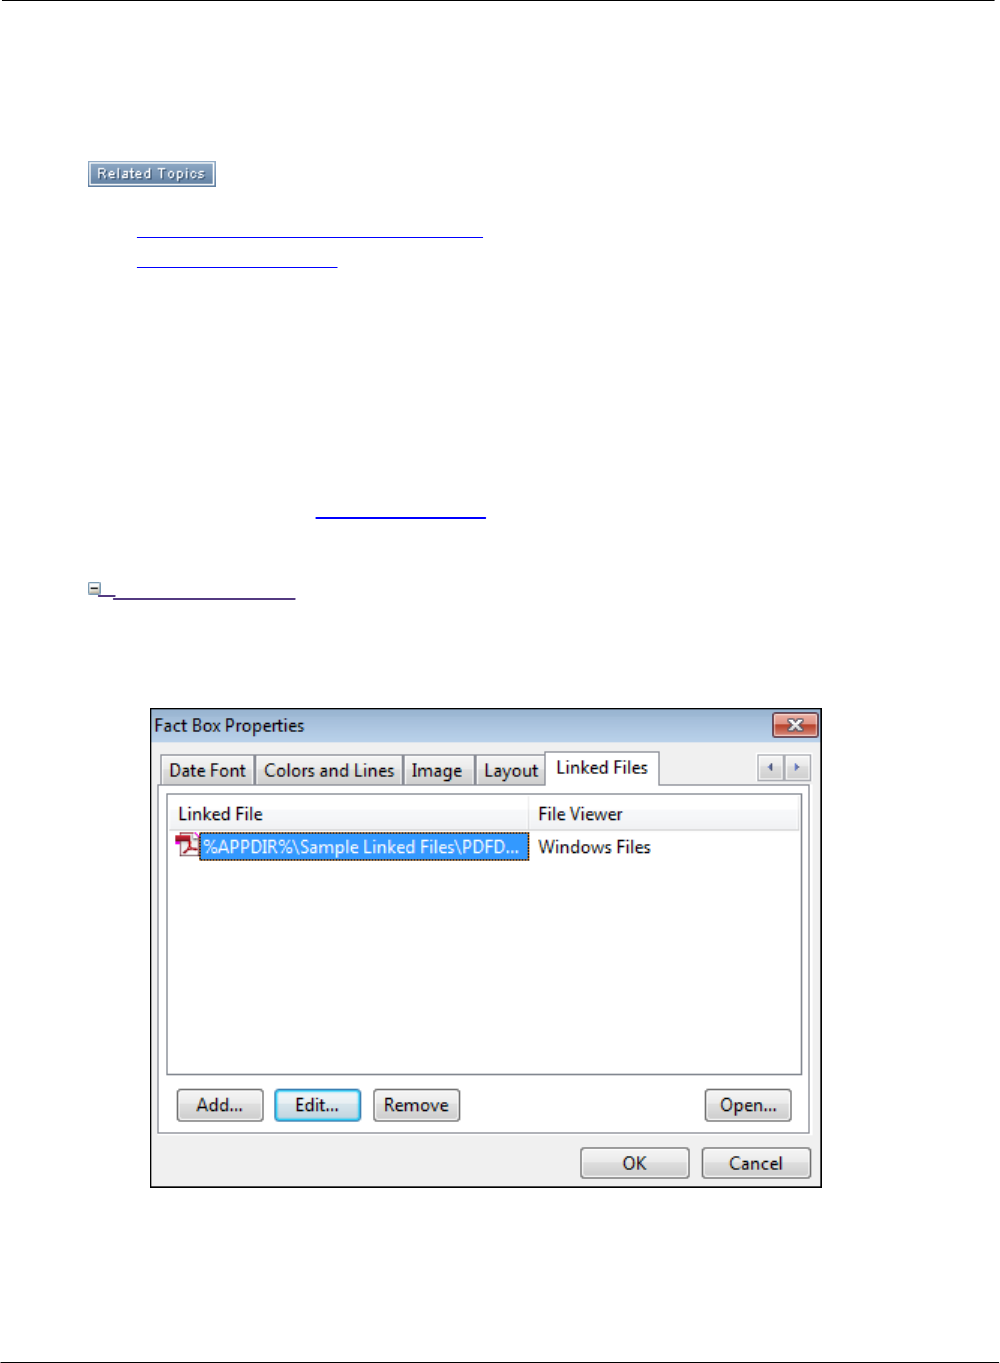
TimeMap80
© 2017 LexisNexis. All rights reserved.
6. Click OK to save your changes.
Related Topics
About customizing timeline elements
Anchoring text boxes
Changing linked files
You can review, add, edit, or remove linked files added to a timeline element in the Properties
dialog box. Additionally, you can change the file viewer needed to view the attachment.
To add a linked file, see Adding linked files.
To edit linked files
1. Select the elements for which you want to edit the line color and style.
2. Double-click the selected elements to open the Properties dialog box.
You can also right-click, and then click Properties.
3. Click the Linked Files tab.
4. In the Linked File box, select the file you want to edit.

Using TimeMap 81
© 2017 LexisNexis. All rights reserved.
6. Click the Edit button to open the Linked File Properties dialog box.
7. In the File Viewer list, select the viewer you want to use to open the attachment or click
the Edit button to add another file viewer.
8. In the Linked File box, review the file path for the attachment by clicking Open or click
Browse to navigate to a new folder location for that file.
9. Click OK to return to the Properties dialog box.
10. Click Remove if you want to delete a linked file attachment from the timeline element.
11. Click OK to save your changes.
Related Topics
About customizing timeline elements
Adding linked files
Applying formatting to timeline elements
TimeMap's Pick Up & Apply Formats feature makes it easy to apply font style and color formats
you have set for one timeline element to another element.
To pick up and apply formatting
1. Select the timeline element that has the format you want to apply to another element.
2. On the Box Tools Format ribbon, click Pick Up.
You can also press Ctrl + Shift + C.
3. Select the timeline element for which you want to apply the format.
4. On the Box Tools Format ribbon, click Apply.
You can also press Crtl + Shift + V.
5. To continue applying this format to other elements, repeat Step 4.
Related Topics
About customizing timeline elements
Using the Fact Design Gallery

TimeMap82
© 2017 LexisNexis. All rights reserved.
Changing the timeline background color
You can set a background color for your timeline. This is a nice option if you want to use a
TimeMap timeline in Full Screen Presentation mode or in a slide presentation in Corel, Microsoft
PowerPoint presentation, Sanction, or Trial Director.
To change the background color
1. On the Box Tools Format ribbon, click Background Fill.
2. On the submenu, select the color you want as a background color.
The timeline immediately displays the background color selected.
Related Topics
Changing timeline default settings
Changing timeline default settings
You can customize the timeline default options to make it easier to create timeline in the styles
you want. For example, when you create a new fact box in TimeMap, it will automatically display
with the color and line style you have selected for the default setting. This also includes the
styles you select for the date and fact text display.
To change timeline default options
1. Click File, and then click Options.

Using TimeMap 83
© 2017 LexisNexis. All rights reserved.
2. In the Options dialog box, click Defaults.
3. In the Category list, click the option you want to customize.
4. Click OK to save your changes.
New timelines will be created based on the options you set.
Related Topics
Changing the timeline background color
Customizing the Time Scale
Inserting time scale breaks
You can insert time scale breaks wherever you want in the timeline to condense the timeline
length. TimeMap automatically recalculates the time scale and removes the maximum amount of
time possible while leaving an indicator in the time scale to note the time gap. You can set the
style of your breaks — choosing among Zig Zag, Jagged, Slant, and Square. Any number of
breaks can be added to a timeline.

TimeMap84
© 2017 LexisNexis. All rights reserved.
To insert a time scale break
1. On the Time Scale ribbon, click Time Scale Breaks.
2. In the Time Scale Breaks dialog box, click Insert.
3. In the New Time Scale Break dialog box, click in the time scale where you want to
insert the break.
TimeMap marks the time scale in white where you selected it and the date is highlighted
in the Date Range box.
4. Click OK.
The timeline is now condensed where you inserted the break.
To edit the time scale break size and style
1. Right-click on the time scale break you want to edit.
2. On the submenu, click Edit Break to open the Edit Time Scale Break dialog box.

Using TimeMap 85
© 2017 LexisNexis. All rights reserved.
3. In the Width list, click on arrows to increase or decrease the width of the break.
You can also right-click on the break and click Expand Break, Compress Break, or Break
Style.
You can also click on the
4. In the Style list, click on one of the following: Square, Slant, Jagged, or Zig-Zag.
5. In the Begin and End fields, click on the arrows to adjust the date range.
6. Click OK to save your changes.
To delete a time scale break
1. Right-click on the time scale break you want to delete.
2. On the submenu, click Delete Break.
The time scale readjusts (expands) to accommodate the timeframe that was previously
hidden.
Related Topics
Changing time scale begin/end dates
Changing time scale date format

TimeMap86
© 2017 LexisNexis. All rights reserved.
Moving the time scale
You can move a timeline's time scale to any location on your chart and display it either vertically
or horizontally. Once the time scale is in place, you can position timeline elements above and
below or to the left and right the scale.
Moving the time scale is helpful when you want to create a chart that compares two sets of
events. Drag the time scale to the center of the chart, then place one set of fact boxes above
the scale and the second set below it. To see a sample of this type of chart, please view the
example chart, #2 - Compare. Examples charts can be selected from the Help menu or in the
Getting Started panel.
You can also make adjustments to the time scale margins and adjust the position in the Time
Scale Properties dialog box.
To move the time scale
1. Place your mouse pointer on the time scale.
2. Drag the time scale to a new location.
To change the time scale margins
1. On the Time Scale ribbon, click the Format dialog box launcher to open the Time Scale
Properties dialog box.
You can also double-click on the time scale.
2. In the Time Scale Properties dialog box, click the General tab.

Using TimeMap 87
© 2017 LexisNexis. All rights reserved.
3. In the Vertical list, click on the distance you want to increase the margin from the top,
center, or bottom of the timeline.
4. In the From list, click on the position for the timeline: Top Margin, Above Center, Below
Center, or Bottom Margin.
5. In the Minimum distance from the left margin list, select the distance you want for left
margin padding.
6. Click OK to save your changes.
Related Topics
Inserting time scale breaks
Changing time scale width
Changing time scale width
As you build TimeMap visuals, there will be instances when you have more fact boxes than can
be effectively displayed on a single page. No problem. Just increase the width of the time scale.
TimeMap automatically regenerates the time scale and moves fact boxes accordingly.
When your TimeMap visual is more than one page wide, TimeMap automatically adds a Page
Break indicator on your screen. If you want to turn off the Page Break feature, clear the Page
Break option on the View menu.

TimeMap88
© 2017 LexisNexis. All rights reserved.
To adjust time scale width
On the Time Scale ribbon, click the Increase Pages Wide button or the Decrease Pages
Wide button.
You can also click on the Increase Pages Wide or the Decrease Pages Wide buttons located
at the bottom left of TimeMap, or type in the number of pages you want in the Pages Wide
box.
Related Topics
Inserting time scale breaks
Moving the time scale
Changing the time scale style
Changing time scale begin/end dates
In TimeMap, you can set beginning and ending dates independent of the dates of your fact
boxes. For example, if you want the time scale to start at the beginning of the year even
though the first fact doesn't occur until February, you can do so.
To set a begin and end date
1. On the Time Scale ribbon, click Begin and End Dates.
The Time Scale Properties dialog box displays to the Begin and End Dates tab.
You can also double-click on the time scale and click the Begin and End Dates tab.

Using TimeMap 89
© 2017 LexisNexis. All rights reserved.
2. In the Begin list, click on the arrow to select the begin date for the timeline.
3. In the Time field, click the arrows to adjust the begin time.
4. Select or clear the first fact's date and time if you want to use it for the begin date.
5. In the End list, click on the arrow to select the end date for the timeline.
6. In the Time field, click the arrows to adjust the end time.
7. Select or clear the last fact's date and time if you want to use it for the end date.
A Stop Scale After Last Date check box is also located on the General tab in the Time
Scale Properties dialog box.
8. Click OK to save your changes.
Related Topics
Inserting time scale breaks
Changing time scale date format
Changing the time scale style

TimeMap90
© 2017 LexisNexis. All rights reserved.
Changing the time scale font
You can change the date font and style that displays in the time scale. Any changes you make
can be previewed before you apply them. This is especially helpful if you are also changing the
time scale color.
To change the time scale font
1. On the Time Scale ribbon, click the Format dialog box launcher to open the Time Scale
Properties dialog box.
You can also double-click on the time scale.
2. In the Time Scale Properties dialog box, click the Font tab.
3. In the Name list, click the font you want to use.
4. In the Size list, select the font size.
5. In the Color list, select the font color.
6. In the Style area, select the style check boxes for those you want to use: Bold, Italic,
Underline, and Strikeout.
7. Click OK to save your changes.
Related Topics
Changing the time scale style
Changing time scale color

Using TimeMap 91
© 2017 LexisNexis. All rights reserved.
Changing time scale date format
You can change date display settings in the time scale, including: date format, type of delimiter,
and whether to display the century or day of week. You can even modify the time setting style
and delimiter.
To change the date format in the time scale
1. On the Time Scale ribbon, click Style.
You can also double-click on the time scale.
2. In the Time Scale Properties dialog box, click the Date Style tab.
3. In the Style list, click the date format you want to use.
4. In the Delimiter list, click Slash, Hyphen, Period, or Space.
5. Select or clear the Show Century or Show Day of the Week check boxes to toggle
these features on or off.
6. In the Style list, click 12-Hour or 24-Hour.
7. In the Delimiter list, click Colon, Period, or Space.
8. Click OK to save your changes.

TimeMap92
© 2017 LexisNexis. All rights reserved.
Related Topics
Changing time scale begin/end dates
Changing the time scale style
Changing the time scale style
TimeMap offers seven different styles you can use for your time scale. Styles offer different
padding options above the date. You can also change the scale position while it previews in the
Time Scale Properties dialog box.
To change the time scale style
1. On the Time Scale ribbon, click Style.
You can also double-click on the time scale.
2. In the Time Scale Properties dialog box, click the Style tab.
3. In the Style list, click on one of the time scale styles.
4. In the Scale Position Preview area, click on the time scale location you want in the
Preview box: Bottom, Middle, or Top.
5. Click on the Colors and Lines tab.
6. In the Fill list, click on the color you want for the time scale.

Using TimeMap 93
© 2017 LexisNexis. All rights reserved.
7. In the Line Color list, click on the color you want as a border around each month in the
time scale.
8. In the Line Style list, click on the style you want to use.
9. Click OK to save your changes.
To change the date label alignment
1. On the Time Scale ribbon, click the Format dialog box launcher to open the Time Scale
Properties dialog box.
You can also double-click on the time scale.
2. In the Time Scale Properties dialog box, click the General tab.
3. In the Date Label Alignment area, select Left or Center.
4. Click OK to save your changes.
Related Topics
Changing time scale color
Changing time scale date format

TimeMap94
© 2017 LexisNexis. All rights reserved.
Changing time scale color
The time scale color can be changed from its default gray to a color that best matches the
design of your timeline. You can also choose whether to include a color line border and style for
each date segment in the time scale.
To change the time scale color
1. On the Time Scale ribbon, click Style.
You can also double-click the time scale.
2. In the Time Scale Properties dialog box, click the Colors and Lines tab.
3. In the Fill list, click the color you want for the time scale.
4. In the Line Color list, click the color you want for the line around each date.
5. In the Line Style list, click the style you want for the line border around each date.
6. Click OK to save your changes.
Related Topics
Changing the time scale font
Changing the time scale style

Using TimeMap 95
© 2017 LexisNexis. All rights reserved.
Arranging Timeline Elements
Moving timeline elements
You have the ability to manually move chart elements in any horizontal or vertical direction on
your timeline. While Text boxes and pictures can be positioned anywhere on your visual,
remember that Fact boxes are connected to a corresponding date on the time scale.
On the Box Tools Format ribbon, choose from the Alignment or Position options that help you
adjust alignment and visibility for selected elements. See the Position timeline elements topic.
The Box Tools Format ribbon also contains automated options for arrangement and stacking of
timeline elements. See the Comparing Auto-Arrange vs. Auto-Stack topic to identify which
feature you want to use.
To learn about anchoring text boxes or managing overlapping fact boxes, see these topics.
To manually move a timeline element
1. Click on the element(s) you want to move.
When you place your mouse pointer over one of the selected elements, the mouse
pointer changes to a four-way arrow.
2. Drag the element(s) to a new position and release the mouse.
Related Topics
Using the Auto-Arrange feature
Using the Auto-Stack feature
Comparing Auto-Arrange vs Auto-Stack
Anchoring text boxes
Positioning timeline elements
Managing overlapping fact boxes
Positioning timeline elements
TimeMap offers a number of items on the Box Tools Format ribbon to assist in arranging the
position of timeline elements.

TimeMap96
© 2017 LexisNexis. All rights reserved.
Positioning Options
Options
Description
Align Top
Positions the tops of all selected elements at the same vertical
position as the first element chosen.
Align Bottom
Positions the bottoms of all selected elements at the same vertical
position as the first element chosen.
Align Left
Positions the left side of all selected elements at the same vertical
position as the first element chosen.
Align Right
Positions the right side of all selected elements at the same vertical
position as the first element chosen.
Center Vertically
Moves a selected group of elements so they are equal distance from
the top and bottom of the chart.
Center Horizontally
Moves the selected group of elements so they are equal distance
from the left and right of the chart.
Distribute Vertically
Positions selected elements in equal increments from the element
with the highest vertical position to the one with the lowest. You
must select three or more elements to use this feature.
Distribute Horizontally
Positions selected elements in equal increments from the element
with the highest vertical position to the one with the lowest. You
must select three or more elements to use this feature.
Bring to Front
Places the selected element of a layered stack of graphics or text on
top for better visibility and emphasis.
Send to Back
Sends the selected element to the bottom of a layered stack of
graphics or text, so that other graphics and text cover it.
To position timeline elements
1. Click the element you want to use as the basis for alignment.
2. Press Shift and click on the other elements you want to align to the first element you
selected.
3. On the Box Tools Format ribbon, choose from the Alignment or Position options that
help you adjust alignment and visibility for selected elements.

Using TimeMap 97
© 2017 LexisNexis. All rights reserved.
You can also right-click, and on the submenu, click Position, and then click the alignment
or position option you want:
Related Topics
Selecting timeline elements
Anchoring text boxes
Anchoring text boxes
TimeMap offers anchoring options for text boxes, which allow you to determine how text boxes
are repositioned as you adjust the width of your timeline. For example, the default title on
TimeMap visuals is a text box that has its anchor property set to the Center of Visual setting.
As you increase and decrease the number of timeline pages, the title automatically moves to
the center of the visual.
You can anchor text boxes to the left margin of the visual, to the center of the visual, or to the
right margin of the visual. You can also set the anchoring to custom, which means your text box

TimeMap98
© 2017 LexisNexis. All rights reserved.
moves to a new relative position as you change the timeline width.
To select the anchor point of a text box
1. Double-click on the Text box to display the Text Box Properties dialog box.
2. Click on the Layout tab.
3. In the Text list, click on the location you want the text displayed in the box.
4. In the Box list, click on the location where you want the Text box displayed in the
timeline.
5. In the Internal Margin area, click in the list boxes to increase or decrease the text
margins within the Text box.
6. Click OK.
Related Topics
Moving timeline elements
Positioning timeline elements
Changing layout settings

Using TimeMap 99
© 2017 LexisNexis. All rights reserved.
Using the Auto-Arrange feature
TimeMap includes an Auto-Arrange feature that helps eliminate instances when fact boxes
overlap each other in the timeline. As you enter facts, the Auto-Arrange feature automatically
repositions existing fact boxes horizontally and vertically, add timeline pages, and add time
scale breaks to eliminate or minimize instances of overlapping.
Sometimes fact flags get positioned on page breaks. While they can be moved to a new
location, TimeMap has a feature that eliminates the need to relocate them in most cases. If a
flag is located on a page break and then does not print entirely on a page, TimeMap will repeat
the flag from its start point on the subsequent page. This is default behavior for both printed
and PDF output.
To auto-arrange fact boxes
1. On the Box Tools Format ribbon, click Auto-Arrange.
If you are not happy with the results, click the Undo button .
To change Auto-Arrange options
1. On the File menu, click Options.
2. In the Options dialog box, click the Auto-Arrange tab.
3. Select check boxes for the options you want enabled.
4. Clear check boxes for the options you want disabled.

TimeMap100
© 2017 LexisNexis. All rights reserved.
5. Click OK to save your changes.
Related Topics
Comparing Auto-Arrange vs Auto-Stack
Using the Auto-Stack feature
Using the Auto-Stack feature
TimeMap's Auto-Stack feature applies a group of commands to your timeline to improve its
appearance.
Auto-Stack comm ands include:
Moving all fact boxes so that the left side is on the date line.
Moving all facts boxes off page break lines.
Arranging fact boxes from the first date.
Stacking fact boxes so they do not overlap.
Avoiding placement of fact boxes on top of other boxes or timeline elements.
Applying a number of other pre-built commands that include avoiding overlapping the date
line and other visual improvements.
To use the Auto-Stack feature
On the Box Tools Format ribbon, click Auto-Stack.
If you are not happy with the results, click the Undo button .
Related Topics
Comparing Auto-Arrange vs Auto-Stack
Using the Auto-Arrange feature
Comparing Auto-Arrange vs Auto-Stack
To help you determine which feature you want to use, review the following list to compare

Using TimeMap 101
© 2017 LexisNexis. All rights reserved.
Auto-Arrange and Auto-Stack benefits.
Auto-Arrange vs. Auto-Stack
Options
Description
Positioning fact
boxes
Auto-Arrange only moves fact boxes that are overlapping other facts
(starting from the far end of the visual)
Auto-Stack repositions all fact boxes.
Auto-Arrange may move facts left or right in horizontal mode / up or
down in vertical mode.
Auto-Stack always places the Fact Boxes on the front edge of their
respective date lines.
Time scale breaks
Auto-Stack removes unnecessary time scale breaks added
automatically by Auto-Stack or Auto-Arrange.
Auto-Arrange never removes time scale breaks.
Page reduction
Auto-Stack may reduce the number of pages wide in a timeline.
Auto-Arrange never reduces the number of pages wide in a timeline.
Entering facts
Auto-Stack is used automatically when you send facts from CaseMap.
Auto-Arrange is optionally run when you manually enter facts into
TimeMap that overlap other facts.
Visual result
Auto-Stack produces a better looking result when a timeline contains
many overlapping facts.
Auto-Arrange does a better job when a timeline has just a few facts
that overlap.
Related Topics
Using the Auto-Arrange feature
Using the Auto-Stack feature
Managing overlapping fact boxes
As you build a timeline, it is common to run into situations where the dates of the facts you are
charting cause fact boxes to overlap. As you insert new facts and modify fact dates, TimeMap
automatically uses its Auto-Arrange feature to move facts horizontally and vertically, add new
pages, and insert time scale breaks to help solve any overlapping problems. If you are ever

TimeMap102
© 2017 LexisNexis. All rights reserved.
unhappy with the results of Auto-Arranging, TimeMap's Undo feature can instantly put things
back the way they were. For more information, see Using the Auto-Arrange feature.
Sometimes Auto-Arrange solves all overlapping problems. Other times, Auto-Arrange solves
some but not all overlapping problems. You may need to manually change positions of fact
boxes, insert additional time scale breaks, or rework the number of pages. If these actions do
not solve the overlapping problem, you may be trying to fit too much information into a single
timeline and you will need to use more than one timeline to tell the story.
Review the following list for solutions you can use to address overlapping Fact boxes in your
timeline.
Increase the width of the time scale
We recommend no more than ten fact boxes to a timeline page. A fact count displays on the
Status bar at the bottom of TimeMap. Divide the fact count by ten to estimate the number of
pages wide the time scale should be. The time scale of a single timeline can be up to 100
pages wide. If you have 200+ fact boxes in a single timeline, you should break the chart into
a series of timelines. See the last item listed.
To increase the width of the time scale, click on the Increase Pages Wide option on the Time
Scale menu. This will increase the number of pages for your timeline. See Changing time
scale width.
Reposition fact boxes
Fact boxes can be moved up and down vertically and can face left or right. Fact boxes can
also be dragged to the left and right off of the vertical line that connects them to the time
scale.
To reposition a fact box, drag it to a new location in the timeline. See Changing fact box
direction and Moving timeline elements.
Adjust the height and width of fact boxes
Tinkering with the height and width of individual fact boxes often helps solve overlapping
problems.
To adjust the size of a fact box, select the box you want to adjust. Place your mouse pointer
over the small square that appears on the side or bottom of the selected box. Your mouse
pointer will display a double-headed arrow. Click and drag to a desired width or height.
See Changing fact and text box layout.
Adjust the width and location of the time scale
The width and location of the time scale can be altered, making it easier to group fact boxes.
For example, reduce the width of the time scale and drag it to the right of the page. This
placement opens up space to the left of the time scale where a first set of fact boxes can be
stacked.
The width of the time scale can be changed by selecting Compress or Expand on the Time
Scale menu. You can also point to the right edge of the scale, then click and drag it to the
left or right. The time scale can be repositioned by clicking the time scale and dragging it to a
new location.

Using TimeMap 103
© 2017 LexisNexis. All rights reserved.
See Moving the time scale and Changing time scale width or height.
Insert time scale breaks
Sometimes a timeline chart includes periods of inactivity due to time gaps between the facts
being graphed. When this situation arises, consider inserting a time scale break to condense
empty space.
See Inserting time scale breaks.
Reduce the amount of text in fact boxes
If your fact boxes contain a lot of information, consider editing the text into succinct
statements. This will save space in the timeline and product a chart that is easier to read
and understand. To edit fact text, double-click on the fact box.
Eliminate non-critical fact boxes
Consider reviewing all fact boxes to determine whether they are essential to the timeline
content you want to communicate. Delete any Fact boxes that do not meet this criticality
test. In doing so, you will solve overlapping problems while making the timeline more
effective. To delete a fact box, select it and press Delete.
Break the timeline into a series of timelines
After trying the above suggestions, you may find that your timeline still contains too many
fact boxes. It may be time to break the timeline into a series of visuals rather than trying to
force all information onto one chart. You can copy a group of fact boxes into a new timeline.
See Copying fact boxes to new timelines.
Related Topics
Positioning timeline elements
Editing Timelines
Using spelling tools
TimeMap includes more than one spelling feature to ensure that timeline text is correct, or
corrected for you, as you type.
Spelling tools include:
Spelling — A spell-check tool that verifies the correct spelling of a word in a text and
description fields (except object short names).
Live Spell Checking — A spelling feature that automatically underlines text (red, wavy line)
that is not recognized by one of the TimeMap dictionaries. Right-click on one of these words

TimeMap104
© 2017 LexisNexis. All rights reserved.
to display a pop-up window with suggestions of possible corrections.
Autocorrect and Dual Initial Cap — A spelling feature that recognizes when two capital
letters are used consecutively or when common words are accidentally misspelled. If you
accidentally type "teh", the Autocorrect tool automatically changes the text to "the". If you
accidentally type "The", the Dual Initial Cap tool automatically shifts to second capital letter
to lowercase.
Dictionary — A standard English dictionary that also includes legal and medical term
dictionaries. The legal dictionary is on be default, the medical dictionary is not. You can turn
the medical dictionary on and make other changes to spelling and Autocorrect settings by
selecting Spelling and Autocorrect Options on the Tools menu.
The red, wavy lines that appear below unrecognized terms (e.g. abcdefghijklm) only
display while you are working in a Fact or Text box. Once you leave the box, the red, wavy
lines do not display in the timeline even if the term remains unrecognizable.
To spell check individual Fact or Text boxes
1. Double-click on the Fact or Text box for which you want to check spelling.
The Fact or Text Box Properties dialog box displays.
Red, wavy lines display under misspelled words or words that have not been added the
dictionary in TimeMap.
2. Right-click on a word you want to correct.
3. On the submenu, select the correct word from the dictionary or click Spelling.
4. In the Spelling dialog box, select one of the following options:
In the Replace With field, type the new spelling you want.

Using TimeMap 105
© 2017 LexisNexis. All rights reserved.
In the Suggestions field, select a new spelling from the list provided.
Click the appropriate button to the right to ignore, change, add, Autocorrect, etc., the
word.
5. Click OK to save the changes.
To spell check a timeline
1. Click the spelling icon on the Quick Access toolbar.
See About TimeMap ribbon and toolbar buttons for more information on how to add
buttons. You can also press F7 to open the Spelling dialog box.
2. In the Spelling dialog box, select one of the following options:
In the Change To field, type the new spelling you want.
In the Suggestions field, select a new spelling from the list provided.
Click the appropriate button to the right to ignore, change, add, Autocorrect, etc., the
word.
As you select a correct option, the spell check tool navigates from one box to the next
until all text in the timeline has been corrected.
3. Click Close when you are finished.
To change spelling options
TimeMap is automatically configured to use a dictionary as well as a legal dictionary. You can
also add additional dictionaries, like a medical dictionary, as needed.
1. On the File menu, click Options, and then click the Spelling tab.
2. Click the Spelling and AutoCorrect button to open the Spelling Options dialog box.
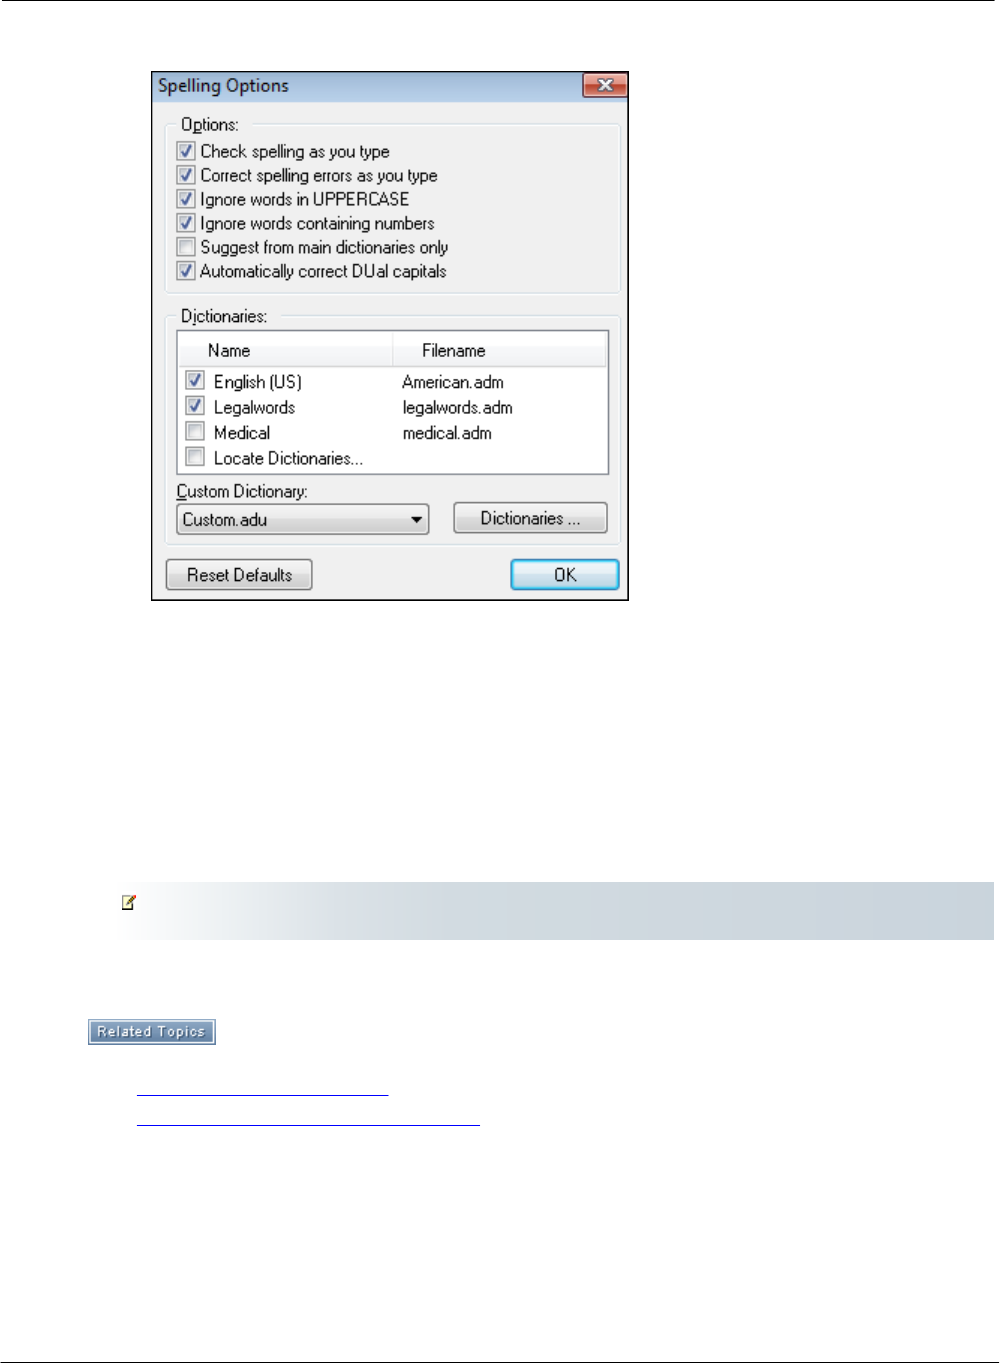
TimeMap106
© 2017 LexisNexis. All rights reserved.
3. In the Options area, select or clear check boxes to toggle spelling features on or off.
4. In the Dictionaries box, select the check box for dictionaries you want turned on.
5. Select Locate Dictionaries to add a dictionary that is saved to your desktop or in a
network folder.
6. Click the Dictionaries button to add a custom dictionary that is stored on your desktop
or in a network folder.
7. Click OK to save the dictionary in TimeMap.
If you click the Reset Defaults button, the spelling options return to their original default
settings.
Related Topics
Finding and replacing data
Copying fact boxes to new timelines
Finding and replacing data
You can locate fact text and dates and replace text in timelines in both Timeline and
Spreadsheet views. When you need to locate a specific word or phrase, use the Find feature to

Using TimeMap 107
© 2017 LexisNexis. All rights reserved.
search timeline content. You can also replace text if you need to change the spelling of a word
timeline.
You also have the option to search for text that is case sensitive or is a particular groups of
words. Selecting the Match Case option provides matches of the text when certain characters
are capitalized. Selecting the Whole Words Only option allows you to search for a particular
word or phrase. For example, if you want to find every occurrence of the whole word "John" in
a field, TimeMap locates all instances of both "John" and "Johnson".
To find and replace fact text
1. On the Box Tools Format ribbon, click Find & Select, and then click Find or Replace to
open the Find and Replace dialog box.
2. On the Find tab in the Find what field, type in the text you want to locate.
3. Select the Match Case check box to locate matches of the word(s) and also when those
words are capitalized.
4. Select the Match whole words only check box to locate a particular word or phrase.
5. Click the Find First or Find Next buttons.
Click the Find First button if you want to start searching from the first fact box in the
timeline.
Click the Find Next button if you want to start searching from the fact box you selected
in the timeline. This option will continue the search until it reaches the original fact box
you started with.
6. Click the Replace button if you want to replace the text found with new text.
7. In the Replace With field, type in the new text you want to use.
8. Click Close when you are finished.
To find a date
1. On the Box Tools Format ribbon, click Find & Select, and then click Go to Date, to open
the Find and Replace dialog box.
2. On the Go to Date tab in the Find date field, type in the date you want to locate.

TimeMap108
© 2017 LexisNexis. All rights reserved.
3. Click the Go to First button.
The timeline element that contains the date you are looking for is now selected.
4. Click the Go to Next button to locate the next instance of the date in your timeline.
5. In the message stating the search is complete, click OK.
6. Click Close when you are finished.
Related Topics
Using spelling tools
Copying fact boxes to new timelines
Copying fact boxes to new timelines
A timeline including too many fact boxes condensed together can become a poor communication
aid. While a TimeMap timeline can include up to 100 pages (horizontally or vertically), a timeline
that includes 100+ fact boxes might be a challenge to arrange so that all are easily visible.
If you have many events that need to be charted in the timeline, you can copy fact boxes to
another timeline to ensure adequate spacing, which visually makes a better presentation.
To copy fact boxes to a new timeline
1. Select the fact boxes you want to copy.
To select a group of fact boxes in Timeline view, press Shift while click on the boxes you
want to copy.
To select a group of fact boxes in Spreadsheet view, press Ctrl while clicking on the fact
rows you want to copy.
2. On the Home ribbon, click Copy, and then click Copy to New Visual.
A new timeline displays and the fact boxes are automatically pasted into it.
3. Arrange the layout of the timeline to increase pages, auto-arrange boxes, etc. until you
get the results you want.
4. Save the new timeline.
5. Return to the original timeline and delete the fact boxes you copied to the new timeline.
The fact boxes will still be selected so you can press the Delete key to remove them.

Using TimeMap 109
© 2017 LexisNexis. All rights reserved.
Related Topics
Using spelling tools
Finding and replacing data
Creating timelines
Creating Presentations
Working in presentation mode
TimeMap makes it easy to present your visual files electronically during meetings, hearings, and
even at trial. Create your timeline graph in a matter of minutes, and then, with one click, shift to
Full Screen mode and present. You can also display files that you have linked to any chart
element using TimeMap's File Linking feature.
Full Screen mode also makes it easy to deliver a presentation based on multiple timelines. For
example, you might use one timeline to present a macro-level picture of events, and a series of
other charts to focus on the details within a specific portion of the larger story.
While you're using Full Screen mode, a special Full Screen toolbar appears at the top of your
timeline. A Pushpin button at the left end of the toolbar allows you to determine whether the
Full Screen toolbar remains visible at all times or Auto Hides itself.
To work in full-screen, presentation mode
1. Create or open a timeline in TimeMap.
2. Click the Full Screen button on the bottom left of the TimeMap status bar.
You can also press F11 to toggle between full-screen mode and your normal view.
3. Click the Close Full Screen button or press the Esc key to return to normal view.
To navigate fact boxes in presentation mode
You can navigate forward or backwards between fact boxes in full-screen, presentation
mode:
Forward: Press the Tab key or click the Select Next Fact button to bring the fact box
into view.
Backward: Press Shift + Tab or click the Select Prior Fact button to navigate
backwards between fact boxes.
To work with multiple timelines in presentation mode
1. Open all the timelines you want to work with before entering Full Screen mode.

TimeMap110
© 2017 LexisNexis. All rights reserved.
2. Click the Full Screen button on the bottom left of the TimeMap status bar.
3. On the Full Screen mode toolbar, click the Windows button to select which timeline you
want to view.
Related Topics
Adding linked files
Send to PowerPoint
Send to Sanction
Printing and Saving Timelines
About printing timelines
Printing your TimeMap timeline requires no more than clicking the Print button on the Quick
Access toolbar or choosing Print on the File menu. TimeMap uses your page setup options to
determine the paper size, orientation, and margins to use when printing. You can also add
page numbers and date and time information to your visual by changing the layout properties
within the Page Setup dialog box.
When you print timelines that are more than one page wide, TimeMap automatically adds page
break markers that you can use to join the pages into one continuous graph. If you do not
want these marks to appear, from the Getting Started pane, click Options, then click the Print &
PDF tab and clear the Print page align guides check box.
TimeMap also supports banner printing for timelines that are more than one page wide. See
Printing a multi-page timeline banner.
TimeMap now has print preview available on the Getting Started page. You can preview a
sample of the print output before sending to the printer. This is available in the Timeline View
and the Spreadsheet View.
To print a timeline
1. On the File menu, click Print, and then click Page Setup.
2. In the Page Setup dialog box, click on the tabs to change settings for paper size, time
scale orientation, margin selections, title page, and layout properties, etc.
3. Click OK to save your settings.
4. Click Print and then click Print to Printer.
You can also click the Print button the on the Quick Access toolbar.
To view the Page Setup table

Using TimeMap 111
© 2017 LexisNexis. All rights reserved.
Reference the following table for a complete listing of page setup options and their
descriptions.
Customizing the page setup and formatting options for reports
Tab
Settings
Page
Choose paper size, width, height and source.
Choose the paper orientation.
Choose the margin sizes.
Spreadsheet
Report
Choose the font and font size.
Select/clear whether to include the following: Gridlines, Break Rows,
Auto-Fit and/or Confidentiality Statement.
Select/clear Print Options for the following: Date & Time, Include Title
Page, Page Number, Include Introduction.
Timeline
Report
Choose the Time Scale Orientation and Page Break Mode.
Select/clear Print Options for the following: Date & Time, Page Number,
Include Title Page, Include Introduction.
Title Page
Choose Orientation, Text Alignment, Border Style and Color.
Edit Content, Graphics and Choose Options to Save as Default or Load
Defaults.
Introduction
Choose settings for Orientation, Text Alignment, Border Style and Color.
Edit Content, Graphics and Choose Options to Save as Default or Load
Defaults.
Related Topics
Printing a multi-page timeline banner
Printing and saving timelines to PDF
Saving timelines as image files
Emailing timelines

TimeMap112
© 2017 LexisNexis. All rights reserved.
Printing a multi-page timeline banner
When TimeMap is not in Banner mode, it prints duplicate information in the right and left
margins of adjoining pages. This is intended to simplify the process of cutting and taping pages
together to form a printed, multi-page timeline.
TimeMap provides a Banner mode for printers that support continuous feed (banner) paper. In
Banner mode, TimeMap ignores the right and left margins on adjoining pages and does not
print duplicate information.
Most printers (including virtually all laser printers) do not support banner printing.
There are two primary methods printers use to support banner printing. Some printers require
you to create a user-defined paper size corresponding to the dimensions of the banner you
want to print. Other printers have a banner mode you must enable in the printer Properties
dialog box before printing. Consult your printer user’s guide to determine if and how it supports
banner printing.
To print a multi-page timeline banner
Determine if and how your printer supports banner paper. You have three options you can
choose to print a timeline banner:
If the printer requires a user-defined paper size for printing banners, proceed with the
Printing a Banner with a User-Defined Paper Size option.
If the printer supports a banner mode, proceed with the Printing in Banner Mode option.
If the printer does not support banner printing, you can cut and tape the multi-page
timeline together.
To print in Banner mode
1. Open the multi-page timeline.
2. On the File menu, click Print, and then click Page Setup.
3. In the Page Setup dialog box, click the Timeline Report tab.
4. In the Page Break Mode area, click Banner.
5. Click the Page tab and select the paper size that corresponds to the size of the banner.
Consult the printer's user guide for specific instructions.
6. In the Page Setup dialog box, select any other print settings needed.
7. Click OK to save the settings.
8. On the File menu, click the Print button and choose one of the following options: Print
to Printer, Print to PDF or Print to PDF Email.

Using TimeMap 113
© 2017 LexisNexis. All rights reserved.
You can also click the Print button the on the Quick Access toolbar.
Related Topics
About printing timelines
Printing and saving timelines to PDF
Printing and saving timelines to PDF
The ability to create a PDF file of your timeline is built into TimeMap. You do not need to own a
full Adobe Acrobat license. When TimeMap creates a PDF file, it can add a bookmark for each
fact, thereby making it easy to navigate to different places in the timeline. Finally, if the fact
flags in the timeline are linked to Windows files (e.g., to a PDF containing the document that
was the source of the fact) these links are also available in the timeline PDF file.
TimeMap Print to PDF menu includes three options:
Print to PDF: saves the PDF in a folder you select
Print to PDF (Email): creates a PDF and includes it in a Microsoft Outlook email you can send
to others
Print & PDF (Options): allows you to customize print settings
The default print options are to print overlapping margins between multiple pages and to print
page align guides. The default Print & PDF (Options) are to create hyperlinks in the PDF file to
Windows linked files, and create bookmarks in the PDF for each fact box. You can modify these
settings.
To print/save a timeline to PDF
1. On the File menu, click Print and then click Print to PDF.
You can also click the Print to PDF button on the Quick Access toolbar.
2. In the Save as PDF dialog box, navigate to the folder where you want to save the file,
then click Open.
3. Type the File name, and then click Save.
4. In the message to view the file, click Yes or No.
To change Print to PDF options
On the File menu, click Print, and then click Print Options.

TimeMap114
© 2017 LexisNexis. All rights reserved.
1. In the Options dialog box, click the Print & PDF tab.
2. In the Printer Options (normal page break mode) area, select or clear the options you
want.
3. In the Print to PDF Options area, select or clear the options you want.
The Facts Overlapping Page Breaks area includes settings that control whether fact
boxes overlap page breaks. If a flag is overlapping a page break, it will not print entirely
on one page. TimeMap's default setting is to use the visual's page break mode. This
setting is on by default when printing and saving a timeline to a PDF file. To change this
setting, select the print option you prefer. The Repeat page break mode repeats the fact
box from its start point on the subsequent page.
4. Click OK to save the settings.
Related Topics
About printing timelines
Printing a multi-page timeline banner
Saving timelines as image files
Saving a timeline as an image file allows you to email it to another trial team member or use it

Using TimeMap 115
© 2017 LexisNexis. All rights reserved.
in another application. Timelines can be saved to a variety of image formats, including
.jpgs., .gifs, bitmaps, Windows metafiles, and custom high-resolution graphics. Files that are
small and easy to email are .jpgs and .gifs. If you save your timeline as an enhanced metafile
(.emf), you can edit it further using Microsoft® PowerPoint® or other similar software.
You can also save the timeline as a custom, high-resolution graphics file that can be used to
make charts. See Making timelines into charts.
To save a timeline as an image file
1. Open the timeline you want to save.
2. On the File menu, click Save As and then click Save As Graphic.
3. In the Save As Graphic dialog box, select the file type you want to use.
4. In the File name field, type a name for the file.
5. Click Save.
Related Topics
Saving timelines to make charts
Saving timelines to make charts
TimeMap offers options for saving your timelines as high resolution .jpgs, .gifs, and bitmaps.
These options can be particularly useful when you want to send a timeline out to a vendor for
enlargement. You may want to talk with the vendor who will be creating your enlargement, in
advance, to determine the desired file type, color format and pixel choices they will need.
A .bmp (bitmap), .gif (Graphics Interchange Format), and .jpeg (Joint Photographic Experts
Group) are all raster image formats. A raster image is also known as a bitmap and is created
from rows of small dots called pixels. Because the raster format uses these fixed dots to create
the image they cannot always be immediately rescaled without losing definition. So if you are
trying to print your graphic at a very large size, these files are not recommended.
A .wmf (Windows Metafile) and .emf (Windows Enhanced Metafile) are vector image formats.
Vector images contain a geometric description which can be rendered smoothly at any desired
display size. A .wmf is a 16-bit format introduced in Windows 3.0. Enhanced Metafile (.emf) is
the newer 32-bit version. An .emf is also used as a graphics language for printer drivers. If you
are exporting for printing, check with your vendor and see if they can accept .emf files. If they
do, this may be your best choice for times when you need to enlarge your timelines for printing.
If you have embedded a raster image into the timeline, the file will always be rendered
using the pixels and the definition will be reduced as you enlarge the timeline.

TimeMap116
© 2017 LexisNexis. All rights reserved.
To save a timeline to make a chart
1. Open the timeline you want to save.
2. On the File menu, click Save As, and then click Save As Graphic.
3. In the File name field, type in a name for the file.
4. In the Save as type list, select Custom Hi-Res Graphic (*.*).
5. Navigate to the folder where you want to save the image file.
6. Click Save.
7. In the Create Custom Graphic dialog box, select the graphic file type you want: JPEG,
GIF, or Bitmap.
8. In the Color Format list, click on the color format you want.
9. In the Pixels Per Inch list, click or type the numbers of pixels you want per inch.
10. Click OK.
Related Topics
About timelines
Creating timelines
Deleting timelines
Exporting Data
Emailing timelines
TimeMap’s Send To option makes it easy to email a timeline to other TimeMap users. Once they

Using TimeMap 117
© 2017 LexisNexis. All rights reserved.
receive the timeline, they can view, edit, and print it. The Send To option can also be used to
send timelines as JPEGs, GIFs, and Windows metafiles.
Please note that sending someone a .tmv file is like sending someone a word-processing
document. If you make changes to your respective copies of a timeline file, you will end up with
two different documents that cannot be automatically merged to create one final file. If you
send a file to someone else to edit, you should not make any changes to your copy of the file
until you receive it back.
To email a timeline
1. On the File menu, click Send To and then click Email Recipient.
2. In the Send To dialog box, select the attachment type you want to use: TimeMap
Visual, GIF, JPEG, or Windows Metafile.
3. Click OK.
A Microsoft
®
Outlook emails displays with the timeline included as an attachment. You
can modify the body text as needed.
Related Topics
Printing and saving timelines to PDF
Send to Sanction 2.x
TimeMap timelines can be run in Sanction in their native form. Edits made in TimeMap appear
immediately in the Sanction chart. You can use hyperlinks from TimeMap timeline flags to
images, audio/video clips and documents stored in Sanction. You can also create a TimeMap
timeline from a Sanction presentation, then run the presentation using the TimeMap timeline
within Sanction.
TimeMap integrates with Sanction in three ways:
Add to Sanction sends your current timeline to Sanction's Timelines bin (under Other
Exhibits)
Show in Presentation displays your timeline in Sanction's Presentation mode
Create a TimeMap timeline from a Sanction presentation that includes hyperlinks from the
Fact flags to the objects you have in the presentation
To integrate with Sanction
1. Open Sanction.
2. On the Tools menu, click Verdict Integrator to open the External Application Setup

TimeMap118
© 2017 LexisNexis. All rights reserved.
dialog box.
3. On the File menu, click Add Pre-Defined and then click TimeMap on the submenu.
4. In the message, click OK.
5. Click OK to close the External Application Setup dialog box.
To add a timeline to Sanction
1. In TimeMap, click the Save button to save your timeline.
2. On the File menu, click Send To and then click Add to Sanction.
You can also right-click in a vacant space of your timeline and click Sent To and then click
Add To Sanction.
In Tree View, the timeline displays in the Timelines bins under Other Exhibits.
To display a TimeMap timeline in Sanction's Presentation mode
1. On the File menu, click Send To and then click Show in Presentation.
The timeline now displays in Sanction's Presentation mode.
The timeline is not saved and added to the Sanction Timeline's bin when you use this
option.
2. Click the Exit button to close the presentation.

Using TimeMap 119
© 2017 LexisNexis. All rights reserved.
For information about TimeMap's presentation mode, see Working in full-screen
presentation mode.
To create a timeline from a Sanction presentation
1. On the Sanction toolbar, click the Presentation menu, then press F3.
The Export to TimeMap dialog box opens.
2. In the Date field, type in the date.
3. In the Text field, type in the text you want.
4. In the Link field, select MainTbllD if you want to use the hyperlinks to Sanction objects
in your timeline.
5. Click Create.
Related Topics
Working in full-screen presentation mode
Send to PowerPoint
Send to CaseMap
Send to Sanction 3.5 or later
To assist in organizing presentations of key evidence for trial, TimeMap allows users to connect to
and send a visual to a case in Sanction
®
3.5. Please refer to the Sanction Answer Center for additional
information.
To send a visual to Sanction as a single page
1. Open a case in Sanction 3.5 or later.
It is necessary to have a case open in Sanction for the Send To LexisNexis Sanction
option to be successful.
2. On the File menu, click Send To, and then click LexisNexis Sanction to open the dialog
box.
3. In the Send to LexisNexis Sanction dialog box, click the As a single page option.

TimeMap120
© 2017 LexisNexis. All rights reserved.
4. Click OK.
The visual is added to the Timelines folder under the Images folder in Sanction.
To send a visual to Sanction as separate pages
TimeMap also gives you options for sending a visual to Sanction as a multi-page exhibit:
With one page for each fact box -- creates a separate exhibit page for each fact box
in the timeline, even if the timeline is only one page. By default, TimeMap dims the
previous facts to make a single fact stand out on each page.
As one image with multiple pages -- simply creates a separate exhibit page for each
page in the timeline. By default, TimeMap will repeat a fact box that is crossing a page
break so that the whole box appears on both pages.
You can adjust the behavior of what each page looks like using the Send to Sanction
options in the Options dialog box. Click the Options button in the Send to Sanction
dialog box to set those options.
1. Open a case in Sanction 3.5 or later.
It is necessary to have a case open in Sanction for the Send To LexisNexis Sanction
option to be successful.
2. On the File menu, click Send To, and then click LexisNexis Sanction to open the dialog
box.
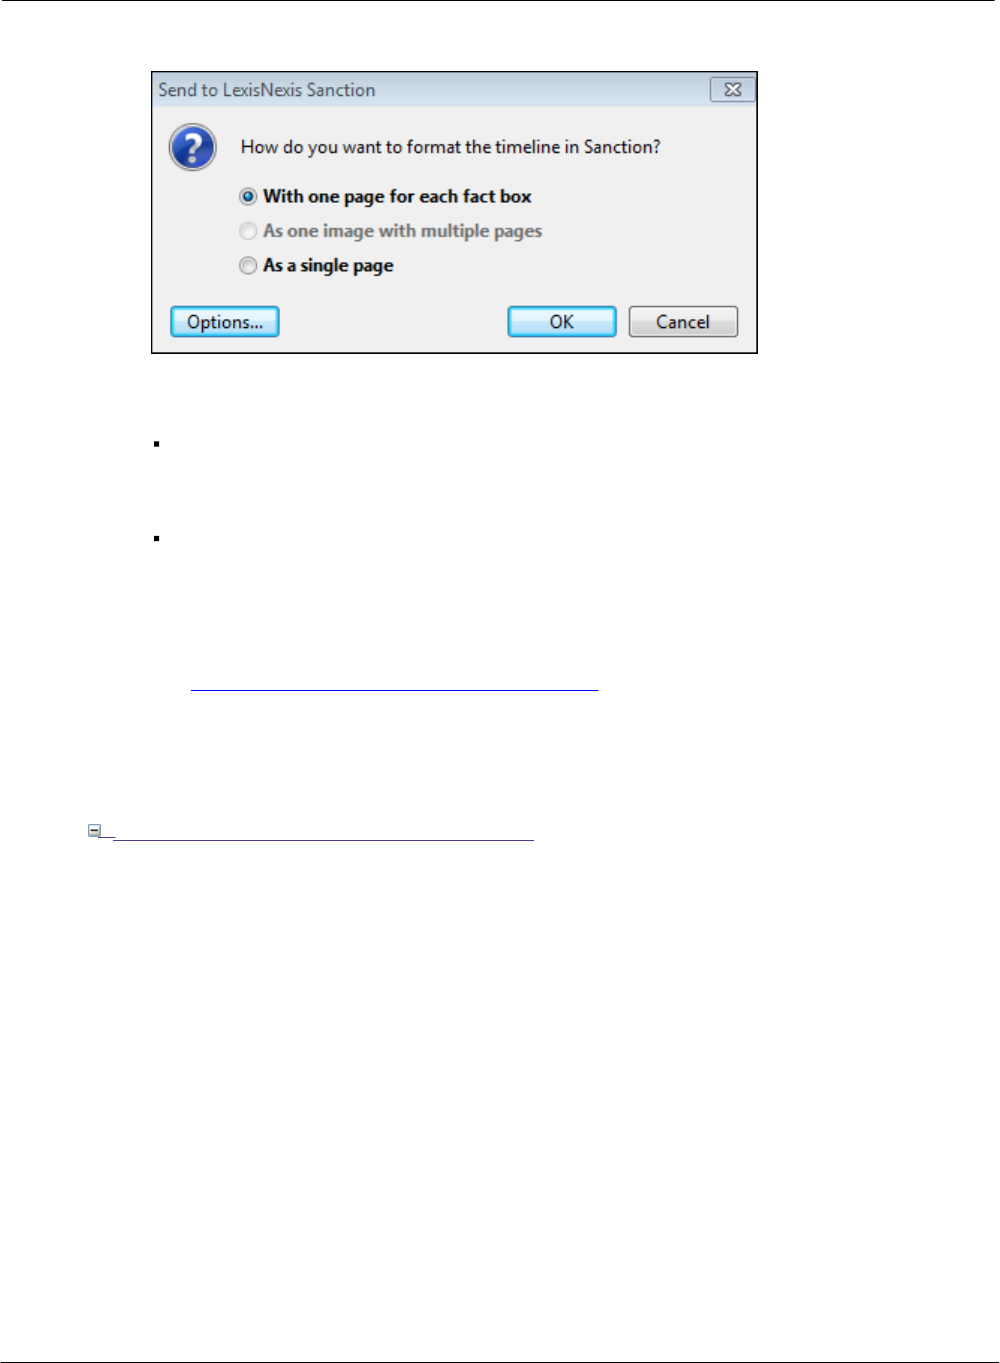
Using TimeMap 121
© 2017 LexisNexis. All rights reserved.
3. In the Send to LexisNexis Sanction dialog box, select one of the following multiple page
options:
Select the 'With one page for each fact box' option if you want to create a separate
exhibit page for each fact box in the timeline, even if the timeline is only one page. By
default, TimeMap will dim the previous facts to make a single fact stand out on each
page.
Select the 'As one image with multiple pages option' to create a separate exhibit page
for each page in the timeline. By default, TimeMap will repeat a fact box that is
crossing a page break so that the whole box appears on both pages.
4. Optional: In the Send to LexisNexis Sanction dialog box, click the Options button to set
different Send To Sanction formatting options.
See To set the Send to Sanction format options for details on how to set different Send
To Sanction formatting options.
5. Click OK.
The visual is added to the Timelines folder under the Images folder in Sanction.
To set the Send to Sanction format options
The Send to Sanction formatting options in TimeMap can be set to determine how pages will
be generated when they are sent to Sanction.
1. On the File menu, click Options, and then click Send To Sanction.
Alternatively, you can click the Options button in the Send to Sanction tab.

TimeMap122
© 2017 LexisNexis. All rights reserved.
2. In the One Page per Fact Options area, next to Past facts and Future facts, click the
down arrow and select the option you want: Normal, Hidden, or Transparent.
3. In the Transparency list, click the arrows to increase or decrease transparency for both
past and future facts.
The default setting is 50%.
4. In the Separate Pages Facts Overlapping Page Breaks area, select the page break
mode you want to use.
5. Click OK to save your settings.
Related Topics
About timelines
Creating timelines

Using TimeMap 123
© 2017 LexisNexis. All rights reserved.
Send to PowerPoint
The Send to Microsoft
®
PowerPoint feature allows you to export your timeline to a Microsoft
®
PowerPoint slide presentation. TimeMap automatically creates a title slide for your presentation
and includes any hyperlinks to Windows files (links to non-Windows files cannot be included).
You must have Microsoft
®
PowerPoint installed on your computer to use this feature.
You have two options for sending a timeline to PowerPoint:
One Slide per Fact — A single slide is created for each fact box in the timeline.
The first slide will be the presentation title page. The second slide will be the first fact of
your chronology. The fact box retains your TimeMap fact style and format. Other fact boxes
will display as semi-transparent and can be hidden from view.
One Slide per Page — Multiple fact boxes display on a single slide.
Send to PowerPoint options permit you to fade flags or hide flags, such as hiding future flags.
You can also choose whether to create hyperlinks to Windows files and select the page break
mode. See the Creating Hyperlink Considerations table for more information.
Everything in your TimeMap timeline will be sent to PowerPoint, except for the page border
frame (this includes the header and footer graphics). The page border is not sent because it is
printed outside the margins of the page and the PowerPoint slides do not include space for the
margins. The orientation of the title page is also changed to match the orientation of the
timeline if necessary. You can only have one page size and orientation in a PowerPoint
presentation, TimeMap allows you to have a different paper orientation for your title page and
introductions. You may notice that a title page that prints as one page from TimeMap may
appear as two pages in PowerPoint. This would likely be caused by the change in orientation of
the title page to match to orientation of the timeline.
To learn more about creating hyperlinks
When fact boxes with linked files are included in the presentation, you can easily open the
file to share it with your audience. You can choose to not include linked files if you do not
want the hyperlinks to display during a slide show or you are saving the PowerPoint file onto
a computer that does not have the linked files on it. If you email the PowerPoint file to
another person, they will not be able to open the linked files.
Review the following table for more information about creating hyperlinks.
Creating Hyperlink Considerations
Creating
Hyperlinks
TimeMap is only able to create one hyperlink per fact box when using
the Send to PowerPoint feature.
TimeMap can only create a hyperlink for files that can be opened in the
Windows Files viewer.
If a fact box has multiple linked files, TimeMap will create a hyperlink
only for the first linked file and skip the others.
TimeMap timelines created from a CaseMap file will retain linked files

TimeMap124
© 2017 LexisNexis. All rights reserved.
Creating Hyperlink Considerations
when you send the timeline to PowerPoint, as long as the linked files
can be viewed in the Windows Files viewer.
* Links created using the Send to CaseMap feature in litigation
support applications will likely not be sent to PowerPoint. This includes
using the Send to CaseMap tool in Adobe Acrobat, Binder,
Concordance, IPRO, JFS Litigator's Notebook, KPMG's Discovery Radar,
LiveNote, Sanction, and Summation. The links to these applications do
not use the Windows Files viewer and require special interfaces that
are restricted by PowerPoint.
Hyperlinks to Adobe Acrobat PDFs can be created if TimeMap's file
viewer setting is set to the Windows Files viewer and the linked file
value only includes the file path and name of the Adobe PDF file you
want to link to.
To modify the file viewer, right-click on the fact box that contains the
hyperlink and click Properties. In the Fact Box Properties dialog box,
click the Linked Files tab. Click the Edit button to open the Linked File
Properties dialog box. In the File Viewer list, click Windows Files. Click
OK to save the settings.
TimeMap can create hyperlink to web pages/URLs if TimeMap's file
viewer setting is set to the Windows Files viewer. The linked file value
must be a valid URL that begins with Internet protocol. For example:
http://www.lexisnexis.com/casemap.
Viewing
Hyperlinks
Hyperlinks in the PowerPoint presentation are invisible rectangular
shapes placed over the associated fact box. In Slide Show view, the
mouse pointer will display as a hand icon if the fact box contains a
hyperlink. In Normal view, right-click on the fact box and click Open
Hyperlink.
Editing
Hyperlinks
You can edit a hyperlink in PowerPoint that is sent from TimeMap. First
ensure that you are in Normal view. Right-click on the fact box
containing the hyperlink you want to edit and then click Edit Hyperlink
on the submenu. If the hyperlink you are editing appears on multiple
slides, you must make the edit in each location where the hyperlink
exists.
Deleting
Hyperlinks
To delete a hyperlink in PowerPoint, first ensure that you are in
Normal view. Right-click on the fact box that contains the hyperlink
and click Remove Hyperlink on the submenu. If the hyperlink you are
deleting appears on multiple slides, you must delete it in each
location where the hyperlink exists.
Troubleshooting
hyperlinks
If you cannot open a hyperlink and receive the error message,
"Cannot open specified file", the most likely cause is that the file
path in the specified hyperlink is not valid or the file does not exist
at the file path specified in the hyperlink. This problem can easily
occur if you move the PowerPoint presentation to another
computer.

Using TimeMap 125
© 2017 LexisNexis. All rights reserved.
Creating Hyperlink Considerations
If a Windows file hyperlink opens from TimeMap, it should also open
from PowerPoint. The easiest way to fix broken hyperlinks is to edit
them in TimeMap and then resend the visual to PowerPoint.
If you email the PowerPoint presentation to another person, the
hyperlinks will only work if the other person has access to the linked
files.
For instance, if you have a hyperlink to a PDF stored in your
computer's local hard drive (c:\my_pdfs\my_pdf_doc.pdf), this
hyperlink will likely not work on other computers. In order for this
hyperlink to work on other computers, the file must exist within the
exact same folder and with the same file name as is specified in the
hyperlink value. Hyperlinks to URLs or web addresses should be
universal and work on different computers.
To send timelines to PowerPoint
1. On the File menu, click Send to and then click Microsoft PowerPoint.
2. Select One Slide Per Fact or One Slide Per Page.
3. In the message regarding linked files, click Yes.
The timeline now displays in a PowerPoint slide presentation.
4. Click to navigate the presentation:
In Normal view, click on each slide to navigate the presentation.
In Slide Show view, click on the slide to navigate from fact flag to fact flag.
In PowerPoint, double-click any timeline element for the option to convert it to a
Microsoft Office drawing object. If you click Yes, you can then edit any element of your
slide using PowerPoint's Picture Tools.
To open a linked file
There are two ways you can open a linked file attached to a fact box:
In Normal view, right-click on the fact box and then click Open Hyperlink.
In Slide Show view, place your move pointer over the fact box to display the file path and
click on it to open the attachment.
In the message to open the file, click Yes.
To modify Send to PowerPoint settings
1. On the File menu, click Send to and then click Send to PowerPoint Options.

TimeMap126
© 2017 LexisNexis. All rights reserved.
2. In the Options dialog box, click the Send to PowerPoint
®
tab.
3. In the General Options area, select or clear the Create hyperlinks in slides to
Windows Files linked files check box depending on your preference.
Once this setting is disabled, TimeMap will no longer create hyperlinks for any timeline
you send to PowerPoint.
Reasons to disable this setting include:
Not wanting to display the hyperlinks in a PowerPoint Slide Show.
Moving the PowerPoint presentation to a computer that does not include the linked
files.
4. Next to Past Facts and Future Facts, click the down arrow and select the option you
want: Normal, Hidden, Transparent.
5. In the Transparency list, click the arrows to increase or decrease transparency for both
past and future facts.
The default setting is 50%.
6. In the overlapping page breaks area, select the page break mode you want to use.
7. Click OK to save your settings.
To customize the timeline presentation in PowerPoint
You can edit and customize your timeline presentation using the many tools provided
internally by Microsoft PowerPoint. You are able to add, delete, and rearrange slides, and
you can add additional elements to slides TimeMap creates. However, you will not be able to
modify the timeline elements that TimeMap generates. For instance, you cannot reposition

Using TimeMap 127
© 2017 LexisNexis. All rights reserved.
fact boxes, edit text, or change colors, once a fact box is in PowerPoint. Any physical
changes to the timeline elements must be made in TimeMap and then sent to PowerPoint.
Each slide TimeMap creates is actually an enhanced metafile picture object placed on a
PowerPoint slide. Therefore, the individual timeline elements are not editable within
PowerPoint.
Related Topics
Working in full-screen presentation mode
Send to Sanction
Send to CaseMap
Send to CaseMap
TimeMap's Send to CaseMap feature makes it easy to take the facts you enter in a timeline and
import them into a CaseMap case file.
To send selected timeline facts to CaseMap
1. In CaseMap, open the case for which you want to import selected facts.
2. In TimeMap, open the timeline you want to use.
3. Press the Shift key while you click on the fact boxes containing information that you
want to send to CaseMap.
4. On the File menu, click Send To and then click LexisNexis CaseMap.
5. Click Selection to send selected facts in the current visual to CaseMap.
To send all timeline facts to CaseMap
1. In CaseMap, open case for which you want to import selected facts.
2. In TimeMap, open the timeline you want to use.
3. On the File menu, click Send To and then click LexisNexis CaseMap.
4. Click All to send all facts in the current visual to CaseMap.
Related Topics
Send to PowerPoint
Send to Sanction

TimeMap128
© 2017 LexisNexis. All rights reserved.
Copying timelines into word processing applications
You can copy a timeline chronology into a word processing application. This is useful if you want
to add your case chronology to a briefs document. TimeMap saves the selected timeline as a
metafile so you can resize it without losing visual quality.
TimeMap offers three copy options:
Copy Entire Visual to Clipboard as a Metafile
All of the elements of your visual will be copied to the clipboard.
Copy One Page of a Visual to Clipboard as a Metafile
If the timeline has multiple pages, select this option to select a one page to copy to the
clipboard.
Copy One Page of a Visual to Clipboard as a Metafile (Repeat Mode)
This option lets you take advantage of the Repeat Mode feature. If a Fact flag is on a page
break (and will not print entirely on a page), TimeMap will repeat the Fact flag from its start
point on the subsequent page.
To copy a timeline to the clipboard
1. Open the timeline you want to copy.
2. On the Home ribbon, click Copy, and then click Copy Metafile to Clipboard.
3. On the submenu, select the from the following:
Copy Entire Visual to Clipboard as a Metafile
If you select this option, proceed to Step 5 below.
Copy One Page of Visual to Clipboard as a Metafile
Copy One Page of Visual to Clipboard as a Metafile (Repeat Mode)
4. In the Select Page to Copy to Clipboard dialog box, select the timeline page you want
to copy and then click OK.
5. Open your word processing document.
6. On the Edit menu of your document, click Paste Special.
Do not click Paste.
You can also right-click and then click Paste Special.
7. In the Paste Special dialog box, select Enhanced Metafile.
The selected timeline now displays in your word processing document.
Using TimeMap 129
© 2017 LexisNexis. All rights reserved.
Related Topics
Managing File Viewers
About file viewers
TimeMap does not have its own viewer to display files linked to your timeline elements. When
TimeMap is installed, there is a Windows Files viewer that is automatically set up for each visual
file. Many external files can be linked to timeline elements using this default file viewer.
TimeMap opens files using the Windows Files viewer by launching an external program such as
Adobe
®
Acrobat
®
, Microsoft
®
Word
®
, Corel
®
WordPerfect
®
, or Microsoft® Excel
®
.
TimeMap also allows you to add native applications as file viewers so you can view native files
in the application in which they originate. You can add as many file viewers as you need to view
the files and documents linked to elements in your timeline. If other users want to view that
same file, they will need to set up the file viewer in TimeMap too.
To view the file, select the timeline element it is linked to and then click on the paperclip icon to
launch the native application. The path to the native file is stored in the Properties dialog box in
the Linked File tab for that timeline.
Learn about adding file viewers
TimeMap has included support for setting up a large number of text and image viewers. If
you know where the viewer application resides and the name of the timeline where your
images are stored, you can set up these pre-defined viewers with ease. However, if you set
up a viewer other than one of TimeMap’s defaults, you may or may not need assistance from
Customer Support. It depends on your knowledge of the document viewer and how it
communicates with other applications.
Learn about setting up custom viewers
Sometimes, it may be necessary to set up a custom viewer. If the viewer supports DDE
(dynamic data exchange), Active X Scripting, or Command Line Parameters, you can
configure the viewer and view the documents from TimeMap. You will need to follow the
directions for setting up a custom viewer below. Depending on your knowledge of document
viewers, it may be necessary to get assistance from Customer Support.
For DDE and Command Line viewers, the path to the viewer application's executable must
be the same on the other computers.
Learn about file viewer options
When adding a file viewer, you can choose from a list of options in the New File Viewer
dialog box.

TimeMap130
© 2017 LexisNexis. All rights reserved.
New File Viewer Options
Options
Description
File > Save to File
Saves the current file viewer's information to a file. This can be
used to copy a file viewer from one case to another.
File > Load from File
Loads a file viewer's information from a file that was previously
saved with the Save to File option.
Clipboard > Copy to
Clipboard
Saves the current file viewer's information to the Windows
clipboard. This can be used to copy a file viewer from one timeline
to another.
Clipboard > Paste
from Clipboard
Loads a file viewer's information from the clipboard that was
previously saved with the Copy to Clipboard option.
Custom Browse >
Enabled
When enabled, the Custom Browse Script is used to control the
browse for file behavior of the file viewer.
Custom Browse >
Edit Script
This lets you edit the Custom Browse Script for the file viewer. The
script enables you to override TimeMap's default behavior when
you browse for a linked file.
Viewer Testing
This option toggles the visibility of the Viewer Testing panel. The
Viewer Testing panel lets you test the behavior of a file viewer
directly from the edit File Viewer dialog box.
Related Topics
Adding/changing file viewers
Setting up custom file viewers
Adding linked files
Adding/changing file viewers
The default file viewer in TimeMap is Microsoft
®
Word. To find out if you have additional file
viewers set up in TimeMap, click on the Home Ribbon and then click File Viewers. The File
Viewers dialog box displays a listing of all programs that have been added to your licensed
copy of TimeMap. Here you can add, remove, and edit file viewers, as well as change the
default viewer being used. Other users who want to view the same native source files need to
ensure they have added necessary applications to the File Viewers dialog box too.
If you need to change file viewers for a set of linked documents, use the Bulk Change File
Viewer utility. This utility changes all linked files in the case that are associated with a selected

Using TimeMap 131
© 2017 LexisNexis. All rights reserved.
CaseMap file viewer to use a different file viewer instead.
We recommend you make a backup copy of the timeline before making any global
changes, like changing file viewers. Once the process is completed, you cannot undo the
changes without restoring a backup copy of the timeline.
To add a file viewer
1. On the Home ribbon, click the File Viewers button.
2. In the File Viewers dialog box, click the Add button.
3. In the Select Viewer Type dialog box, select the viewer you want from the Viewer Type
list, then click OK.
If the file viewer is not listed, select Custom, then click OK.
For more information, see Setting up custom file viewers.
4. In the New File Viewer dialog box, click OK.
The new file viewer is now listed in the File Viewers dialog box and source files
associated with this program can now be opened in TimeMap for this user.
5. Click Close to return to the timeline.
To set up a default file viewer
1. On the Home ribbon, click the File Viewers button.
2. In the File Viewers dialog box, click the Add button.
3. In the New File Viewer dialog box, click the Options button and then click File from the
submenu.
4. Click Save as a Default Viewer Type.

TimeMap132
© 2017 LexisNexis. All rights reserved.
5. In the message to confirm the selection, click OK, and then click OK to close the New File
Viewer Dialog Box.
The name of the selected viewer now displays in the Default Viewer for Visual area of
the File Viewers dialog box.
To remove a file viewer
1. On the Home ribbon, click the File Viewers button.
2. In the File Viewers dialog box, click on the viewer that you want to delete.
3. Click the Remove button.
4. In the message to confirm the removal, click Yes.
The name of the selected viewer is now removed from the File Viewers dialog box.
Related Topics
About file viewers
Setting up custom file viewers
Adding linked files
Setting up custom file viewers
File viewers added to TimeMap may be used by other team members as long as the application
is installed on their machine. For DDE (dynamic data exchange) and Command Line viewers, the
path to the viewer application’s executable must be the same on the other users’ computers.
Choose from the following custom file viewer ty pes:
Command Line is for applications controlled through command line parameters.
DDE is for applications controlled through the Windows protocol called DDE (dynamic data
exchange).
Script is for applications controlled through ActiveX scripting and/or Windows OLE/COM
protocols.
To set up a custom file viewers
1. On the Home ribbon, click the File Viewers button.
2. In the File Viewers dialog box, click the Add button.
3. In the Select Viewer Type dialog box, click on the viewer that you want assigned to
each timeline element when you add a linked file attachment, then click OK.

Using TimeMap 133
© 2017 LexisNexis. All rights reserved.
4. Click OK to display the New File Viewer dialog box.
5. In the Viewer Name field, type in the name you want to reference the viewer.
Make the name as short and descriptive as possible.
6. In the Viewer Type list, click on the type of viewer: Command Line, DDE, or Script.
The Command Line viewer is for applications controlled through command line
parameters.
The DDE viewer is for applications controlled through the Windows protocol called DDE
(dynamic data exchange).
The Script viewer is for applications controlled through ActiveX scripting and/or
Windows OLE/COM protocols.
For Command Line and DDE viewers
For Command Line and DDE viewers you must provide the File Viewer Application Path.
Click Browse to locate the executable of the application you will use to view documents.
When you select the application's executable, the full path to the executable appears in
quotes in the File Viewer Application Path field.
Type any applicable command line parameters after the full path to the application's
executable. Use the replaceable parameter %1 to represent the Linked File value.
For DDE viewers
For DDE viewers, you must provide the DDE data required for TimeMap to communicate
with the file viewer application.

TimeMap134
© 2017 LexisNexis. All rights reserved.
1. In the Application/Service field, type the DDE application/service parameter value.
2. In the Topic field, type the DDE topic parameter value.
3. In the DDE Message field, type the DDE command(s) to open the viewer and display a
document.
Use the %1 replaceable parameter to represent the document Linked File value. The
%1 is replaced with the selected record's Linked File value when the command is
carried out.
For Script viewers
For Script viewers you must provide the following information:

Using TimeMap 135
© 2017 LexisNexis. All rights reserved.
1. In the Script Language list, click the scripting language used by the script code:
VBScript, JScript, and JavaScript.
2. In the Main Routine and Parameter Defaults field, type the name of the script code's
main subroutine.
A description of the Parameter Defaults is provided in the default script code.
3. In the Script Code box, type the script code to communicate with the file viewer.
Please note the %1 replaceable parameter is not used by Scrip file viewers. The value
of the selected record's Linked File field is passed as a parameter into the script's
main subroutine. Multiple parameter values must be delimited by the pipe character in
the Linked File field.
7. Click OK to save the new file viewer in the timeline.
The new custom file viewer now displays in the File Viewers dialog box.
8. In the File Viewers dialog box, click Close.
Related Topics
About file viewers
Adding/changing file viewers
Adding linked files

TimeMap136
© 2017 LexisNexis. All rights reserved.
Managing TimeMap Options
Customizing TimeMap options
Once your timeline is created, you can customize many of TimeMap's features and standardize
them according to any internal guidelines, timeline needs, or user preferences.
To customize case options
1. On the File menu, click Options.
2. Select the tab you need to adjust various custom settings.
Reference the Customizing Case Options table for setting details for each options tab.
3. Click OK to save any changes.
To view the case options table
Reference the following table for a complete listing of case options and their descriptions.

Using TimeMap 137
© 2017 LexisNexis. All rights reserved.
Customizing TimeMap Options
Tab
Settings
General
Select/clear whether to always create backups of timelines.
See Backing up timelines.
Press the Clear Recent Visual Lists button to remove timelines and
templates from displaying.
See About the Getting Started pane.
Defaults
Edit TimeMap defaults settings for date formats, fact boxes, file viewers,
fonts, orientation, page setup, picture, scale break, text boxes, and
views.
Auto-Arrange
Select/clear Auto-Arrange and Auto-Stack settings and parameters.
See Using the Auto-Arrange feature and Using the Auto-Stack feature.
File Locations
Change the file locations used when opening TimeMap.
See Adding linked files.
Reference the directory location of timeline visuals, templates, import
files, linked files, clip art pictures, graphics, and PDFs.
Linked Files
Select/clear whether to shows the Linked File indicator (paperclip icon)
in Full or Non-Full Screen mode, and adjust the display delay in
milliseconds.
See Working in full-screen presentation mode.
Spelling
Change how TimeMap corrects and formats text and updates the
dictionaries.
See Using spelling tools.
Print & PDF
Select/clear printer options for normal page break mode.
Select/clear Print to PDF options.
See Printing and saving timelines to PDF.
Select the Facts Overlapping Page Breaks setting.
Choose whether to use the visual's page break mode, always use
repeat page break mode or never use repeat page break mode.
Send to
PowerPoint
Select/clear to create hyperlinks in slides to Windows Files linked files.
See Send to PowerPoint.
Select the One Slide per Fact options for past and future facts, and
adjust transparency settings.
TimeMap138
© 2017 LexisNexis. All rights reserved.
Customizing TimeMap Options
Tab
Settings
Select the One Slide per Page Facts Overlapping Page Breaks setting.
See Managing overlapping fact boxes.
Send to
Sanction
Choose One Page per Fact options.
Send to Plug
Ins
View and manage Plug-In options for TimeMap.
See Send to PowerPoint, Send to Sanction, and Send to CaseMap.
Select the Separate Pages Facts Overlapping Page Breaks setting.
Choose whether to use the visual's page break mode, always use
repeat page break mode or never use repeat page break mode.
User
Information
Enter your user name and organization.
Accessibility
Select/clear Accessibility options for TimeMap.
See Changing accessibility options.
Related Topics
Changing accessibility options
Changing accessibility options
TimeMap accessibility options include choosing the ability to support custom menus, use a
standard Windows menu for the main menu bar, and to select all text when entering data in
spreadsheet cells.
To change accessibility options
1. On the File menu, click Options.

Using TimeMap 139
© 2017 LexisNexis. All rights reserved.
2. Click the Accessibility tab and in the dialog box, select the check box to enable the
option:
Use standard Windows menu in place of ribbon
3. Click OK to save your changes.
You must restart TimeMap for changes in this option to take effect.
Related Topics
Changing toolbar buttons and settings
Backing up timelines
Timeline data is valuable and performing regular backups ensures that your data is safe and
retrievable in case of an emergent event. We recommend that you back up timelines to a folder
on a network server each night. If you do not have a network, then you should back up files to
an external drive.
To back up timelines
1. On the File menu, click Options.
2. On the General tab, select the Always create backups check box.
3. Click OK.
Related Topics
About timelines
Creating timelines
Saving timelines
Deleting timelines

TimeMap140
© 2017 LexisNexis. All rights reserved.
Using Keyboard Shortcuts
Using keyboard shortcuts
The following list includes the default keyboard shortcuts you can use in TimeMap. You can also
customize keyboard shortcuts.
Keyboard Shortcuts
Type/Menu
Shortcut Keys
Use
File
New
Ctrl + N
Open
Ctrl + O
Save
Ctrl + S
Print
Ctrl + P
Edit
Undo
Ctrl + Z
Redo
Ctrl+Shift+Z
Cut
Ctrl + X
Copy
Ctrl + C
Paste
Ctrl + V
Delete
Del
Select All Facts
Ctrl + A
Select All
Ctrl + Shift + A
Properties for
Box
F2
Insert
Insert Fact
Ins
Tools
Spelling
F7
Format
Auto-Arrange
Ctrl + T
Bold
Ctrl + B
Using TimeMap 141
© 2017 LexisNexis. All rights reserved.
Keyboard Shortcuts
Type/Menu
Shortcut Keys
Use
Italics
Ctrl + I
Underline
Ctrl + U
Align Left
Ctrl + L
Align Center
Ctrl + E
Align Right
Ctrl + R
Align Justify
Ctrl + J
Pickup Format
Ctrl + Shift + C
Apply Format
Ctrl + Shift + V
Selecting Chart
Elements
To select an
element
Tab and Shift + Tab
To select next
element
Tab
View
Full Screen mode
F11
Related Topics
Customizing keyboard shortcuts
Customizing keyboard shortcuts
TimeMap offers numerous keyboard shortcuts to address most all of your needs. You can add
or edit a shortcut key, if the need arises.
To create or edit keyboard shortcuts:
1. On the Quick Access toolbar, click the More Buttons icon at the far right of the toolbar and

TimeMap142
© 2017 LexisNexis. All rights reserved.
then click Customize Keyboard Shortcuts.
2. In the Customize Keyboard dialog box, select the menu in the Categories list and then
select the item in the Commands list.
If there is already a keyboard shortcut for this menu item, the command displays in the
Current keys list and a description displays below indicating its current use.
3. To change the command, type in a new one in the Press new shortcut key box and click
the Assign button.
4. Click Close.
If you click the Reset All button, the key commands return to their original default settings.
Related Topics
Using keyboard shortcuts

Index 143
© 2017 LexisNexis. All rights reserved.
Index
- A -
about
file viewers 129
Getting Started task pane 19
navigating TimeMap 10
printing timelines 110
TimeMap menus 16
toolbar buttons 11
accessibility options
changing 138
adding
fact boxes 37
fact styles 32, 64
file viewers 130
introduction pages 29
linked files 51
new facts 32, 64
pictures and clip art 46
text boxes 44
timeline titles 28
title pages 29
applying
formatting styles 81
Auto-Arrange
changing options 99
comparing with Auto-Stack 100
Fact box alignment 99
Auto-Stack
comparing with Auto-Arrange 100
fact boxes 100
- B -
backups
backing up a timeline 139
- C -
case options
customizing 136
CaseMap
send facts 60
changing
accessibility options 138
Auto-Arrange options 99
border color and styles 78
box line defaults 32, 64
date alignment 92
date alignment settings 75
date display 40
date fonts 72
date format and style 40
direction of fact boxes 69
fact display options 74
fact styles 32, 64
file viewers 130
fill color 76
layout settings 79
linked files 80
PDF print options 113
spell checking options 103
text and font styles 71
time scale color 94
time scale color and style 92
time scale date formats 91
time scale dates 88
time scale fonts 90
time scale margins 86
time scale width 87
timeline background color 82
timeline default settings 82
timeline elements, about 70
charts
saving timelines as charts 115
clip art
adding 46
alignment options 95
changing border color and styles 78
changing fill color 76
changing linked file settings 80
changing the layout 79
deleting 58
copying
fact boxes 108
timeline elements 57
timelines to the clipboard 128
creating
templates 53
timelines 27
custom

TimeMap144
© 2017 LexisNexis. All rights reserved.
custom
file viewers 132
customizing
case options 136
date text 75
keyboard shortcuts 141
timeline elements, about 70
- D -
dates
adding alternate date text 40
changing alignment 75
changing date format and style 40
changing fonts 72
customizing 75
customizing date display 40
entering in timelines 40
set time scale begin and end dates 88
showing/hiding 74
deleting
fact boxes 37
pictures or clip art 58
time scale breaks 83
timeline elements 58
timelines 59
- E -
editing
time scale break size and style 83
timeline elements, about 70
emailing
timelines 116
exporting
copying timelines to the clipboard 128
emailing timelines 116
Send to CaseMap 127
Send to PowerPoint 123
Send to Sanction 117
- F -
fact boxes
adding 37
aligning with Auto-Arrange 99
aligning with Auto-Stack 100
alignment options 95
changing border color and styles 78
changing date alignment 75
changing date fonts 72
changing directions 69
changing display options 74
changing linked file settings 80
changing text and font styles 71
changing the fill color 76
changing the layout 79
copying to new timelines 108
customizing date text 75
deleting 37
managing overlaps 101
navigating in presentation mode 109
spell checking 103
Fact Design Galley
add new facts 32, 64
apply fact styles 32, 64
change box line defaults 32, 64
fext boxes
changing border color and styles 78
file viewers
about 129
adding 130
changing 130
removing 130
setting up, custom 132
setting up, default 130
finding
dates 106
text 106
formatting
applying format styles 81
- G -
Getting Started task pane
about 19
- H -
Hawkins vs Anstar
practicing with sample data 21

Index 145
© 2017 LexisNexis. All rights reserved.
- I -
importing
data from text files 61
send facts from CaseMap 60
inserting
time scale breaks 83
- K -
keyboard shortcuts
customizing 141
using 140
- L -
linked files
adding 51
opening 51
- M -
menus
about 16
moving
time scale 86
timeline elements 95
- N -
navigating
about 7
about menus 16
about title and status bars 10
changing toolbar buttons 15
modifying the navigation pane 8
toolbar buttons, about 11
navigation pane 8
- O -
opening
custom templates 53
linked files 51
timelines 24
overlapping
fact boxes 101
- P -
PDF
print options 113
printing 113
pictures
adding 46
alignment options 95
changing border color and styles 78
changing fill color 76
changing linked file settings 80
changing the layout 79
deleting 58
presentations
full-screen mode 109
navigating Facts boxes 109
Send to PowerPoint 123
Send to Sanction 117
working with multiple timelines 109
printing
Banner mode 112
changing PDF options 113
multi-page banners 112
timelines 110
to PDF 113
- Q -
Quick Start tutorial 21
- R -
removing
file viewers 130
replacing
text 106
resizing
timeline elements 57
- S -
sample data
Hawkins vs Anstar 21
practicing with sample data 21

TimeMap146
© 2017 LexisNexis. All rights reserved.
saving
timelines 27
timelines as image files 114, 115
timelines as templates 53
timelines to make a chart 115
to PDF 113
searching
dates 106
text 106
selecting
timeline elements 56
Send facts from CaseMap 60
Send to CaseMap
all timeline facts 127
selected timeline facts 127
Send to PowerPoint
changing settings 123
creating hyperlinks 123
customizing the timeline 123
opening a linked file 123
Send to Sanction
adding TimeMap to Sanction 117
creating a timeline from a Sanction presentation
117
displaying a timeline in presentation mode 117
sending a timeline 117
spell checking
changing options 103
fact or text boxes 103
timelines 103
Spreadsheet view
about 24
deleting facts 58
selecting fact records 56
status bar
about 10
- T -
templates
creating 53
text boxes
adding 44
alignment options 95
changing text and font styles 71
changing the fill color 76
changing the layout 79
changing the linked file settings 80
selecting the anchor point 97
spell checking 103
text files
importing 61
time
entering in timelines 40
time scale
changing color 94
changing color and style 92
changing date alignment 92
changing date formats 91
changing dates 88
changing fonts 90
changing margins 86
changing width 87
deleting breaks 83
editing break size and style 83
inserting breaks 83
moving 86
timeline
adding a title 28
changing default settings 82
timeline elements
alignment options 95
applying formatting styles 81
changing fill color 76
copying 57
customizing, about 70
deleting 58
moving 95
positioning elements 95
resizing 57
selecting 56
Timeline view
about 24
deleting facts 58
selecting elements 56
timelines
about 24
adding introduction pages 29
adding title pages 29
backing up 139
changing the background color 82
closing 24
copying to the clipboard 128
creating 27
deleting 59
emailing 116

Index 147
© 2017 LexisNexis. All rights reserved.
timelines
entering dates 40
entering times 40
opening 24
presentation mode 109
printing 110
printing banners 112
printing to PDF 113
saving 27
saving as image files 114, 115
saving to make a chart 115
saving to PDF 113
spell checking 103
TimeMap
changing accessibility options 138
navigating 7
title bar
about 10
toolbar buttons
about 11
changing 15
tutorial
Quick Start 21
- U -
using
keyboard shortcuts 140
